2023 Solar and Batteries
(8/11/2023)
![]()
2023 Solar and Batteries(8/11/2023)
|
|
On Friday, August 11, at about noon, the final step from the City of Austin to install a solar meter was done and my system of Tesla Powerwalls and Solar Panels powered up. This page documents a few things about my solar and battery installation. Click on any photo for a much larger highest resolution original I have.
List of Items Installed:
- 75 solar panels, 385W
Meyer Burger
- 75
Enphase IQ8M (IQ8M-72-2-US)
- 5 Tesla "Powerwall 2" - each of these stores 13.5 kWh, each can produce 7
kW peak (5 kW continuous), and each 30 Amps
so the 5 battery "pack" stores 67.5 kWh in total,
can drive 25 kW continuously, and 150 Amps
- 1 Tesla "backup gateway" - this is a computer in a waterproof box
that controls the batteries
- 1 Enphase gateway/monitor panel
My Solar Installer: HEsolar in Austin, TX.
Longevity:
I get asked sometimes about how long the system is expected to last, and I
think there is some mis-information floating around probably from the earliest
days of solar panels. The solar panels I installed have a 25 year warranty
that guarantees they will still produce electricity 25 years later at 92% of
what they do when first installed or the solar panel manufacturer will replace
them for free. The batteries and associated controller "backup gateway"
have a 10 year warranty that says after 10 years the batteries will still charge
to at least 70% of what they can be charged to on the first day of operation.
The battery warranty includes "unlimited charge/discharge" cycles when used in
the way I'm using them (solar panels to charge batteries, discharge batteries to
power house). Realistically it is 1 charge/discharge cycle every day for
10 years then.
Now, the above is just the warranty (the minimum no matter what), not the ACTUAL performance and longevity of the system. I'm guessing the manufacturer build in a little error margin into that. So maybe an average solar panel still works at 95% at the end of 25 years, and maybe the batteries last 15 years on average. Time will tell.
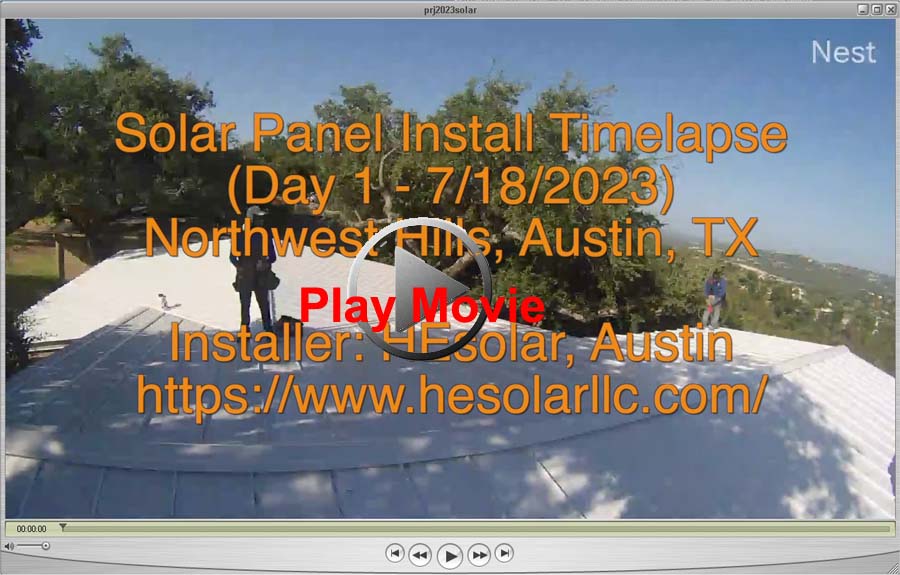
First, a time lapse movie of the solar panels getting installed on the roof. Click here for original movie.
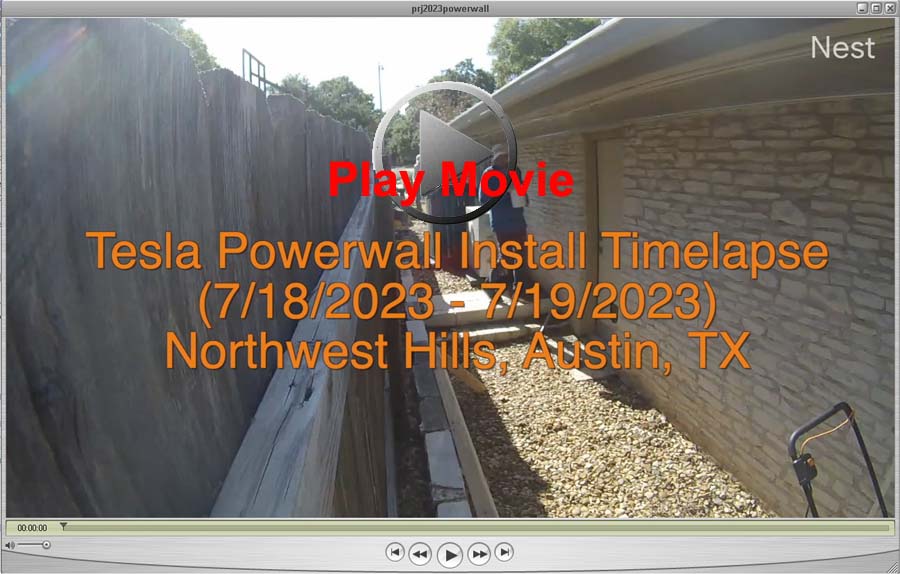
And below here is a time lapse of the electrical work. Original here.
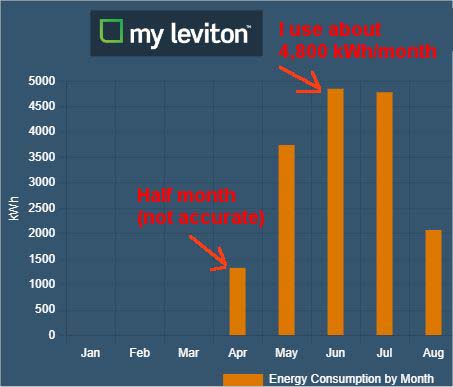
Below has nothing to do with the solar or batteries. I have a Leviton Smart Load Center that monitors all my electrical use in my house. The screenshot below was taken BEFORE the solar panels were installed. It shows I use about 4,800 kWh/month. So the goal of the solar array is to produce that much. The first bar for "April" was the month the Smart Load Center was installed, so it isn't complete. The last bar is taken part way through August so also is not complete.
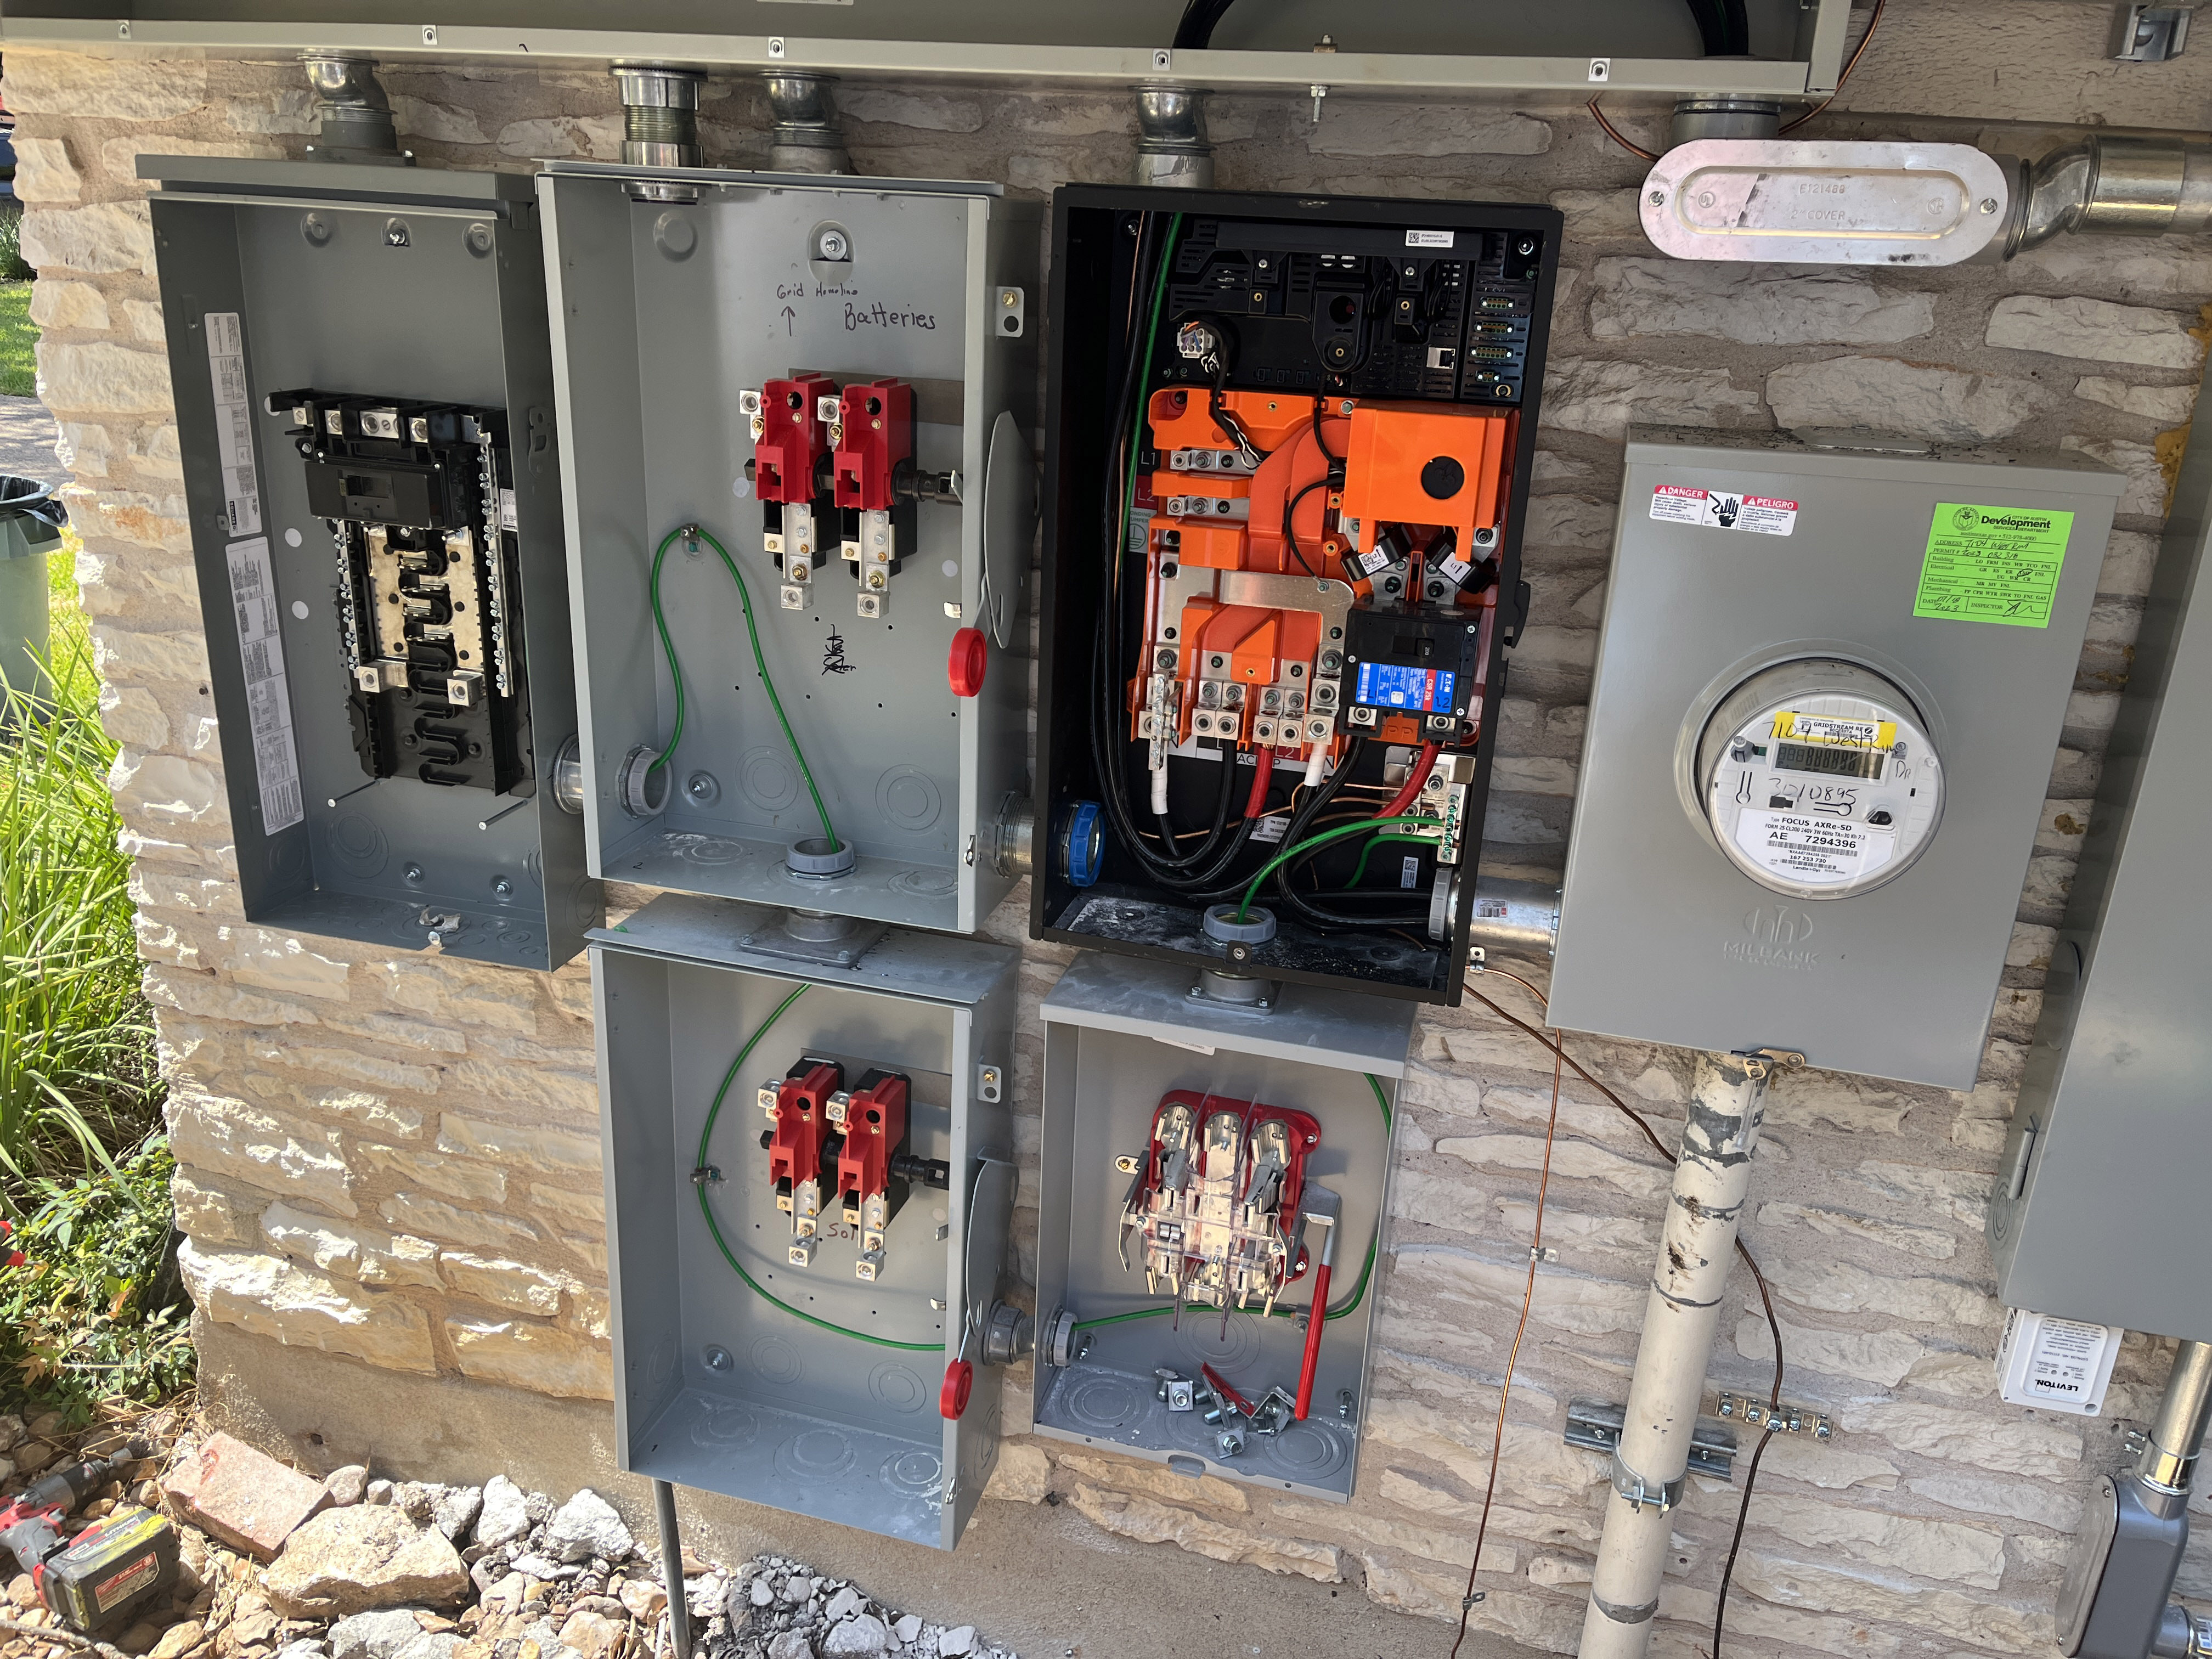
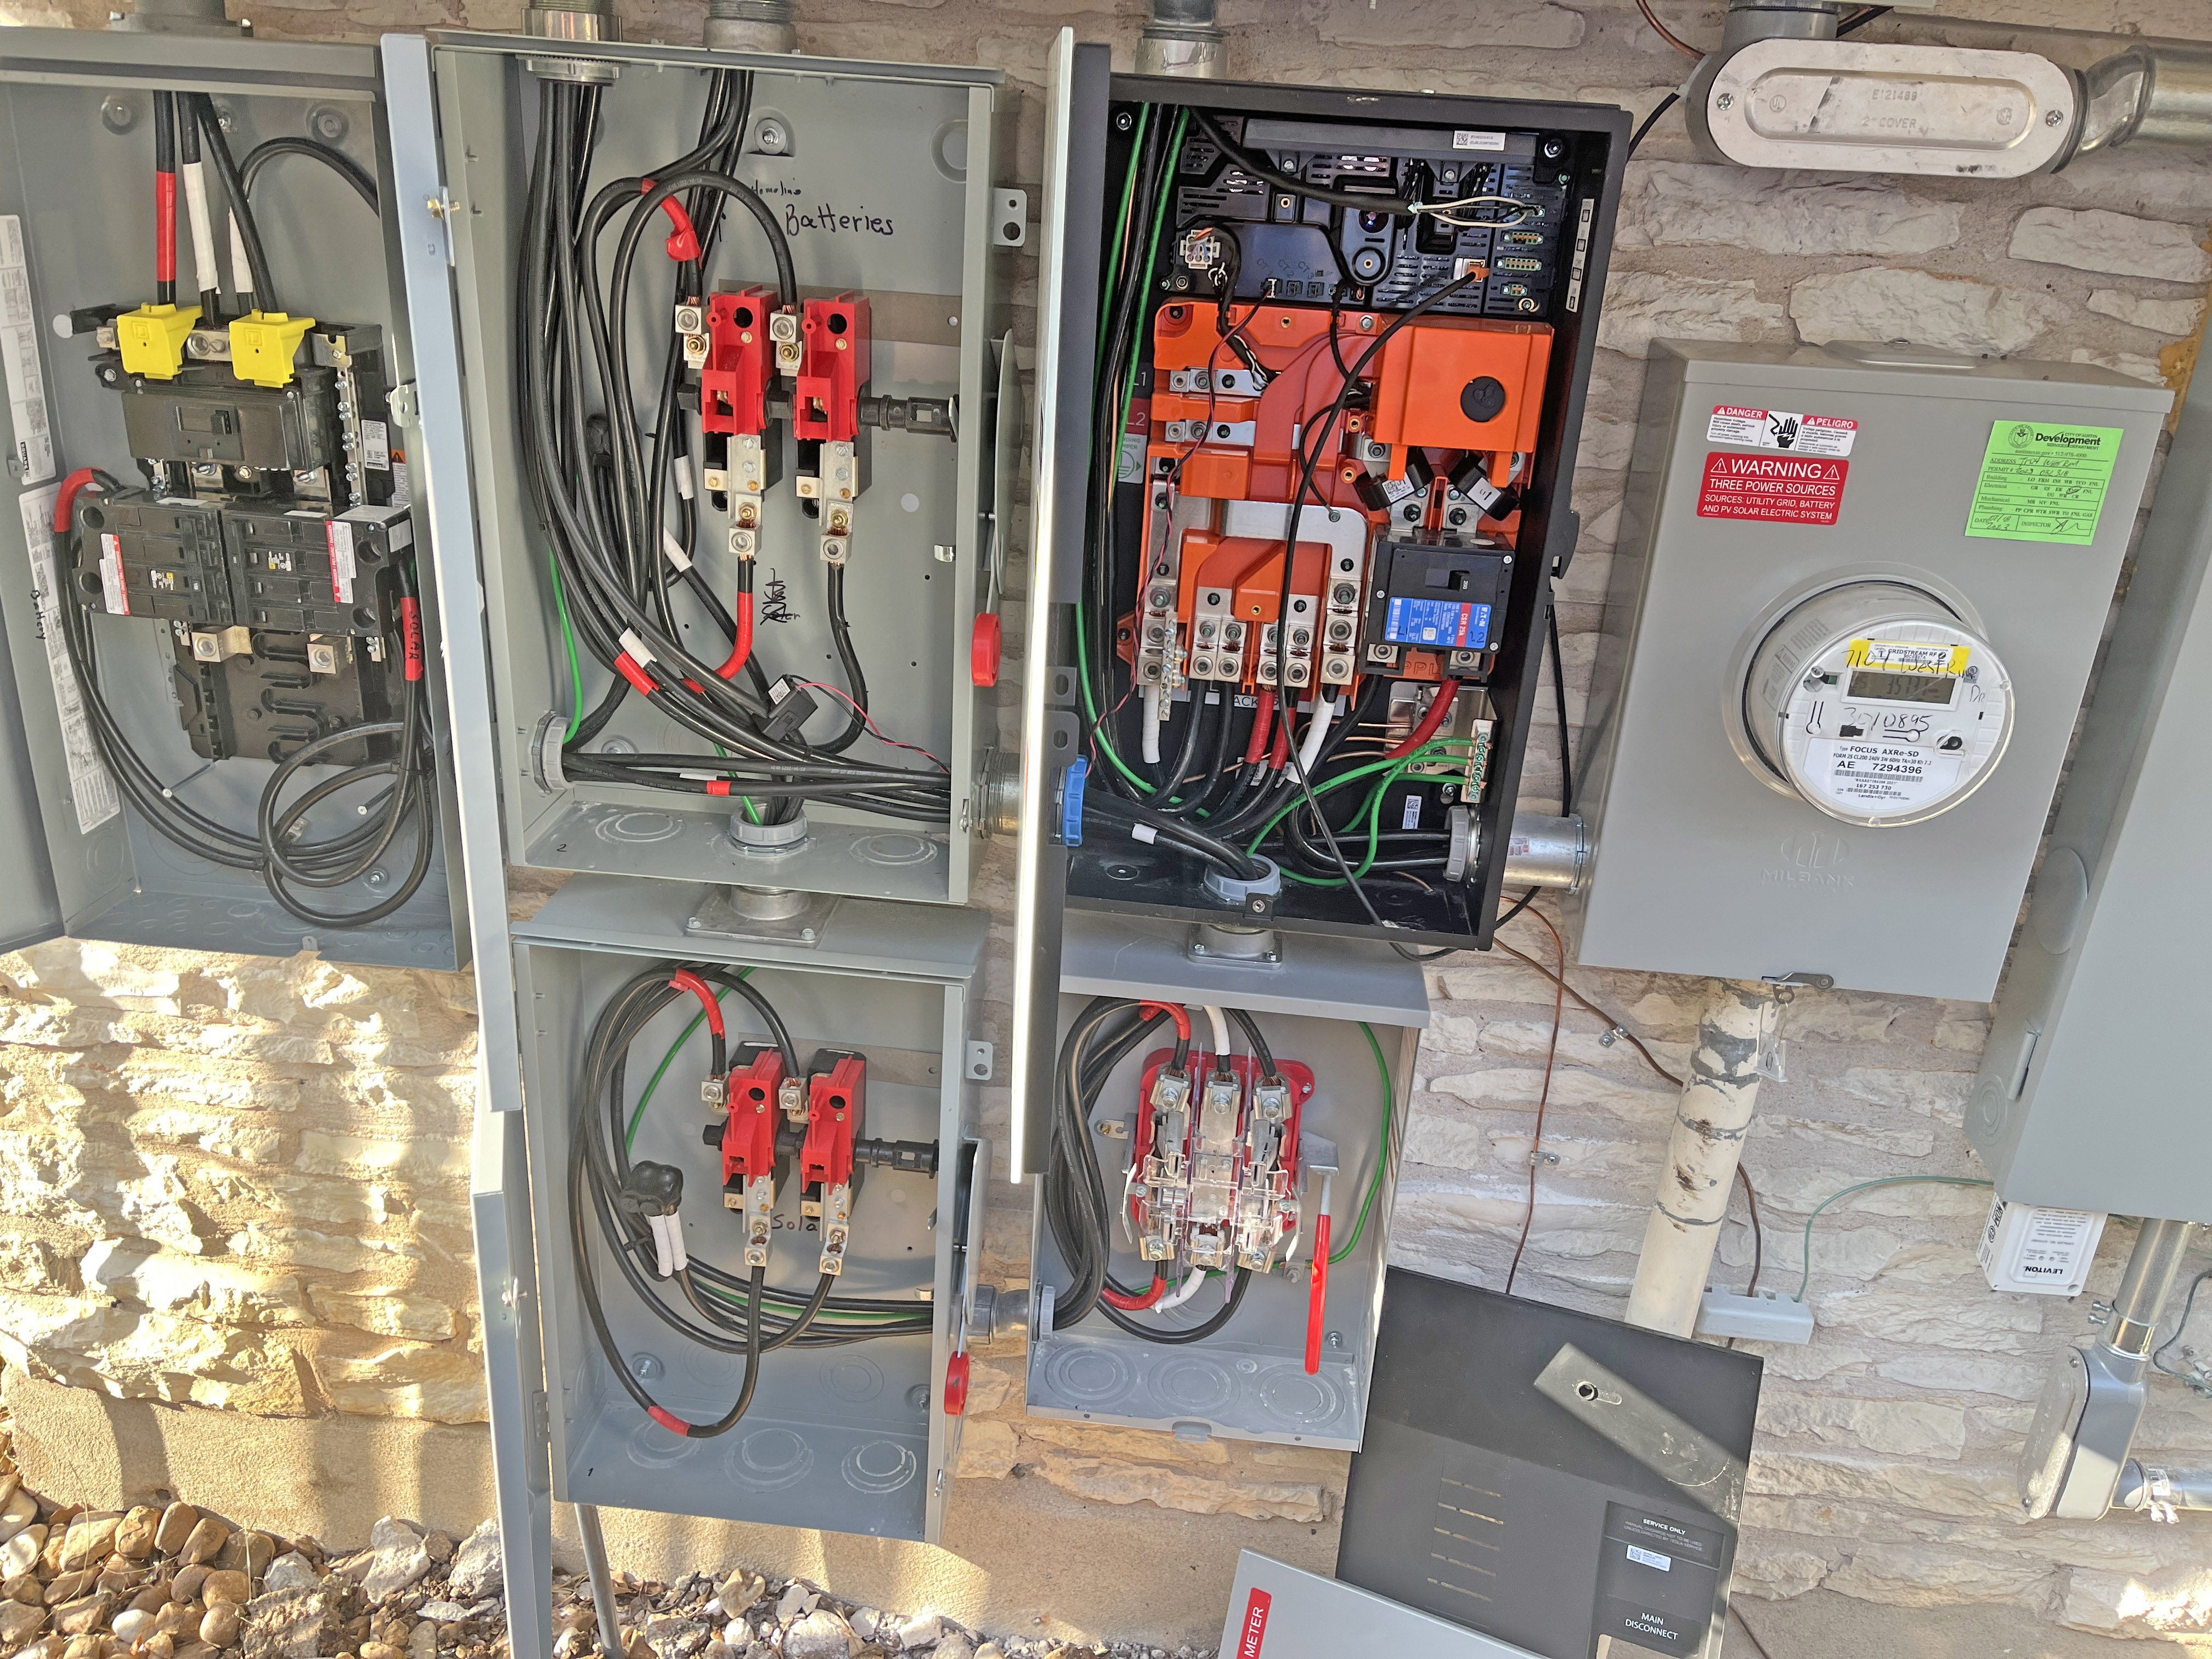
Below shows the electrical panels part way installed at the end of the first day. The whole install of batteries, solar, and all the electrical work took 3 days.
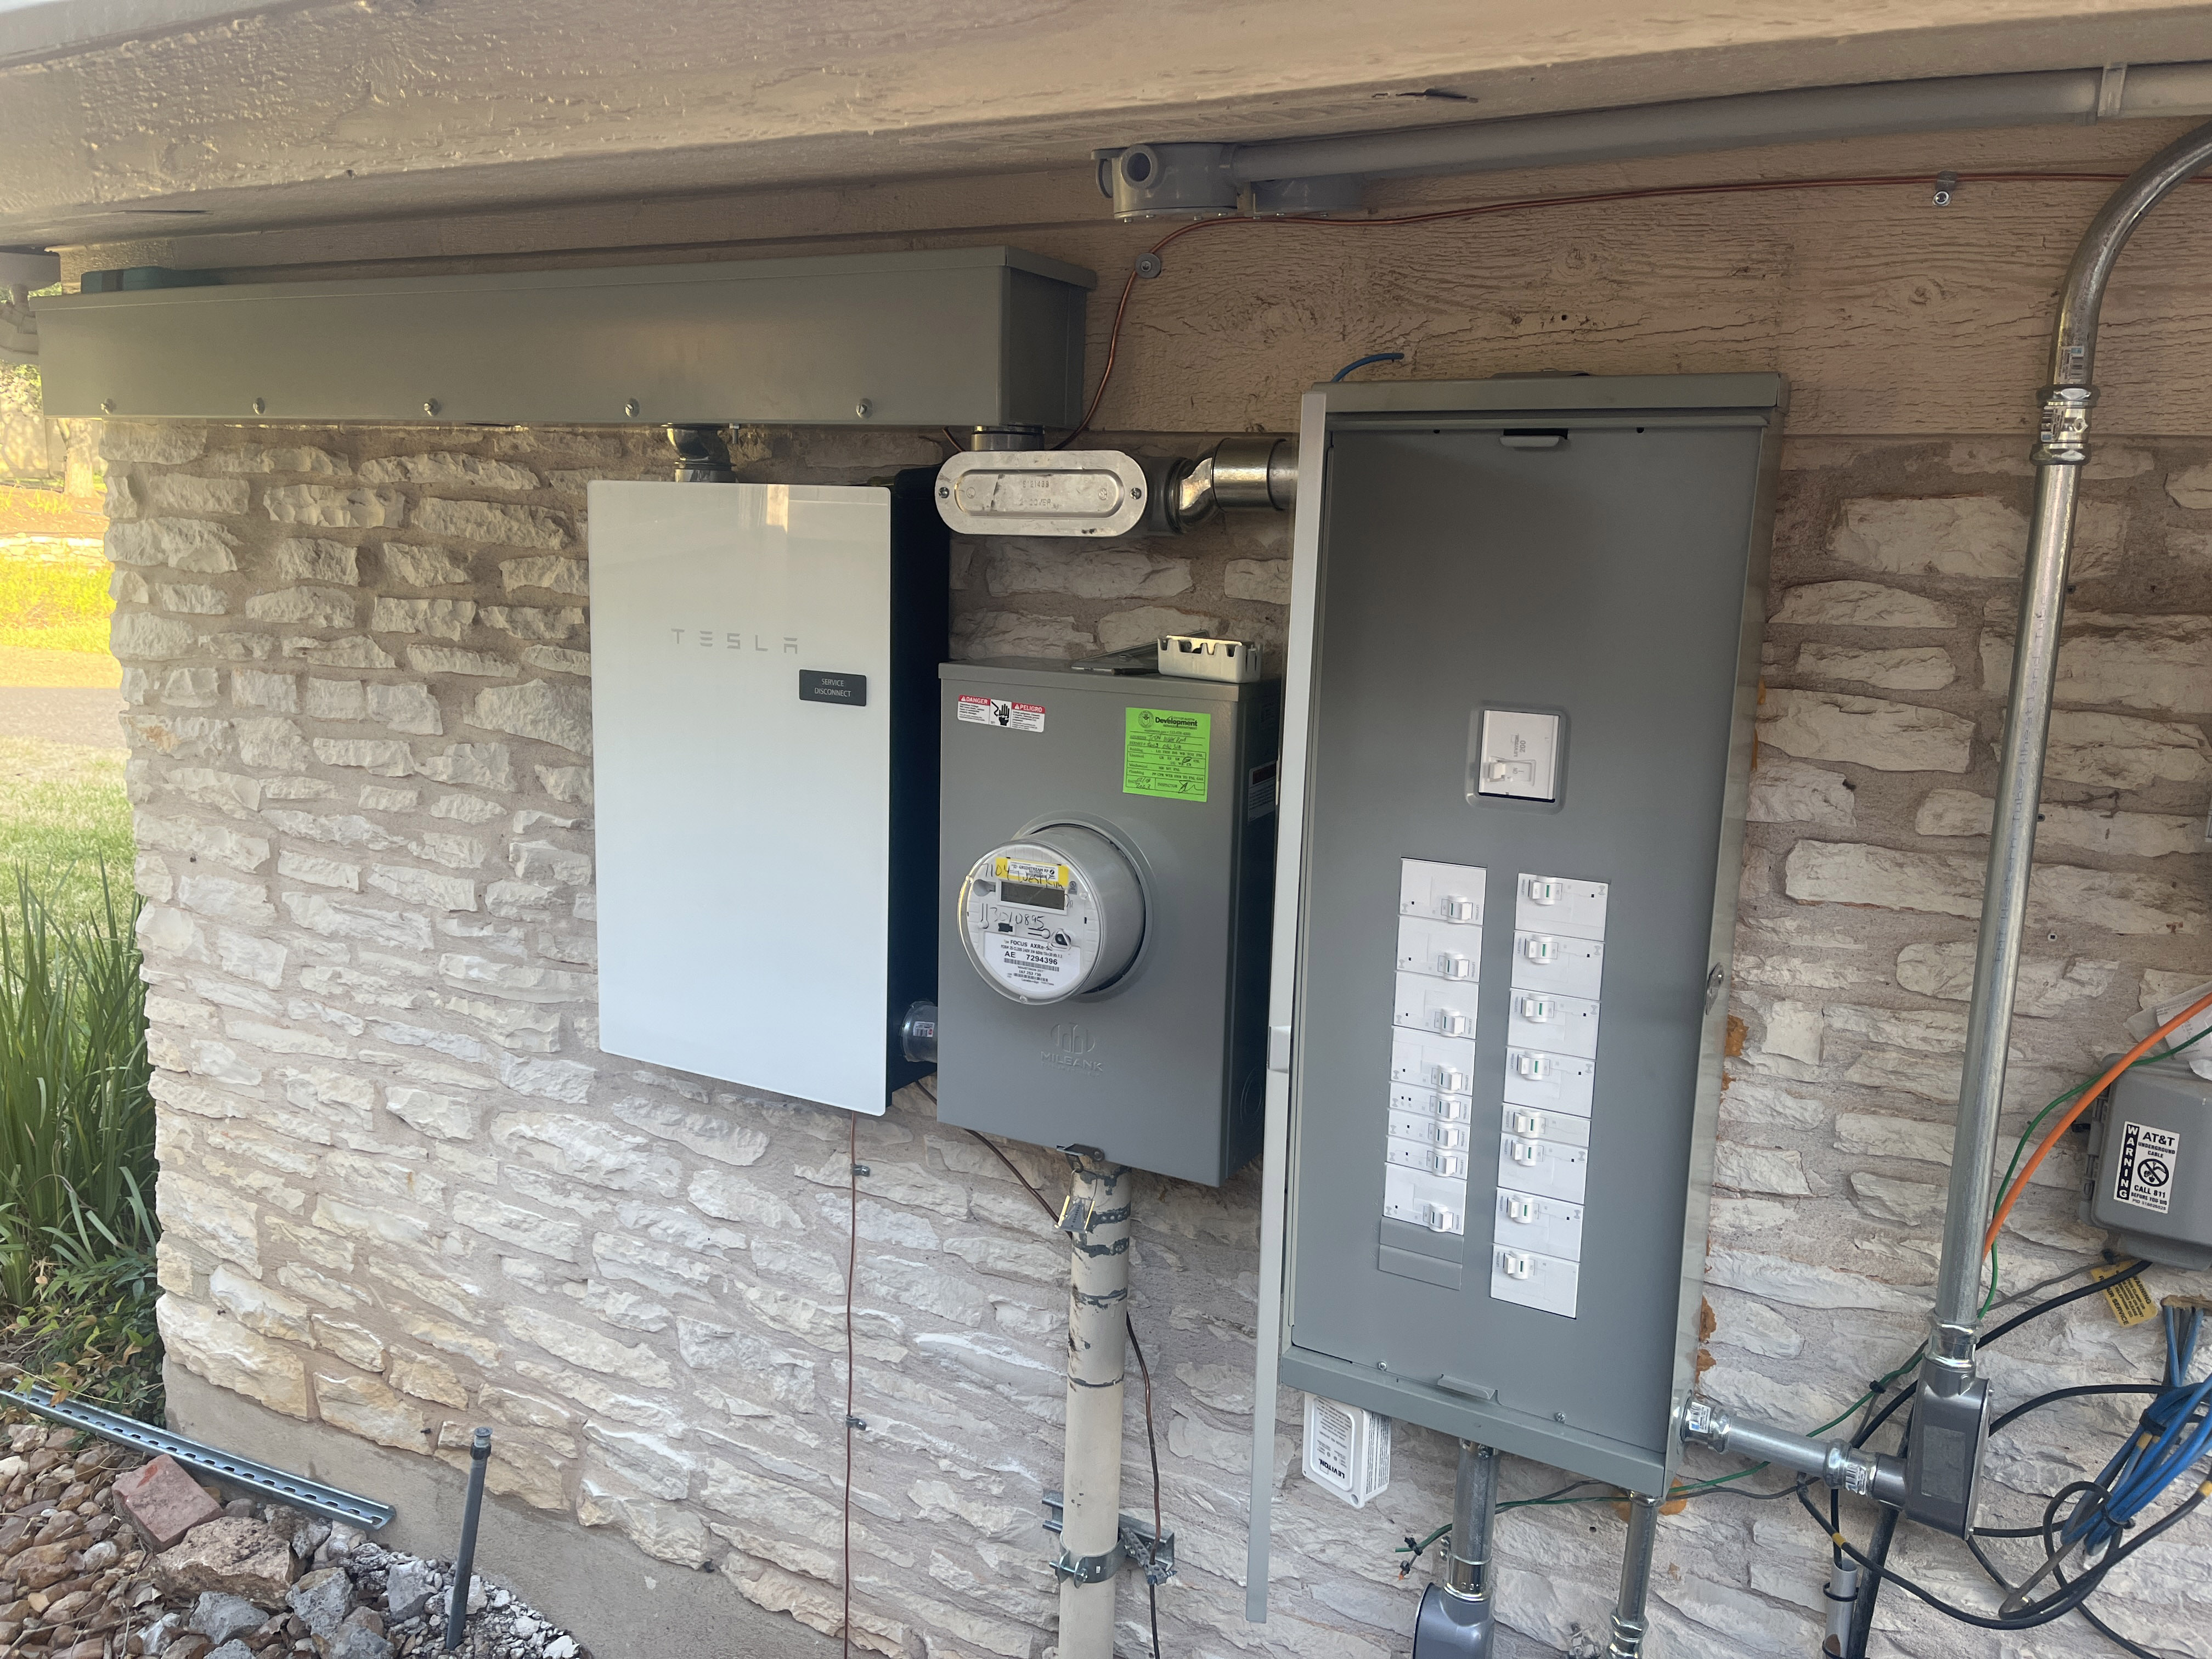
Even before the above picture, this shows the Leviton Smart Panel open and only the Tesla Backup Gateway installed.
The picture above is the total final setup with all the panels open for the City of Austin Inspector to examine it all. After this, some of these panels are closed and a "lock" put on them to prove I haven't tampered with the contents.
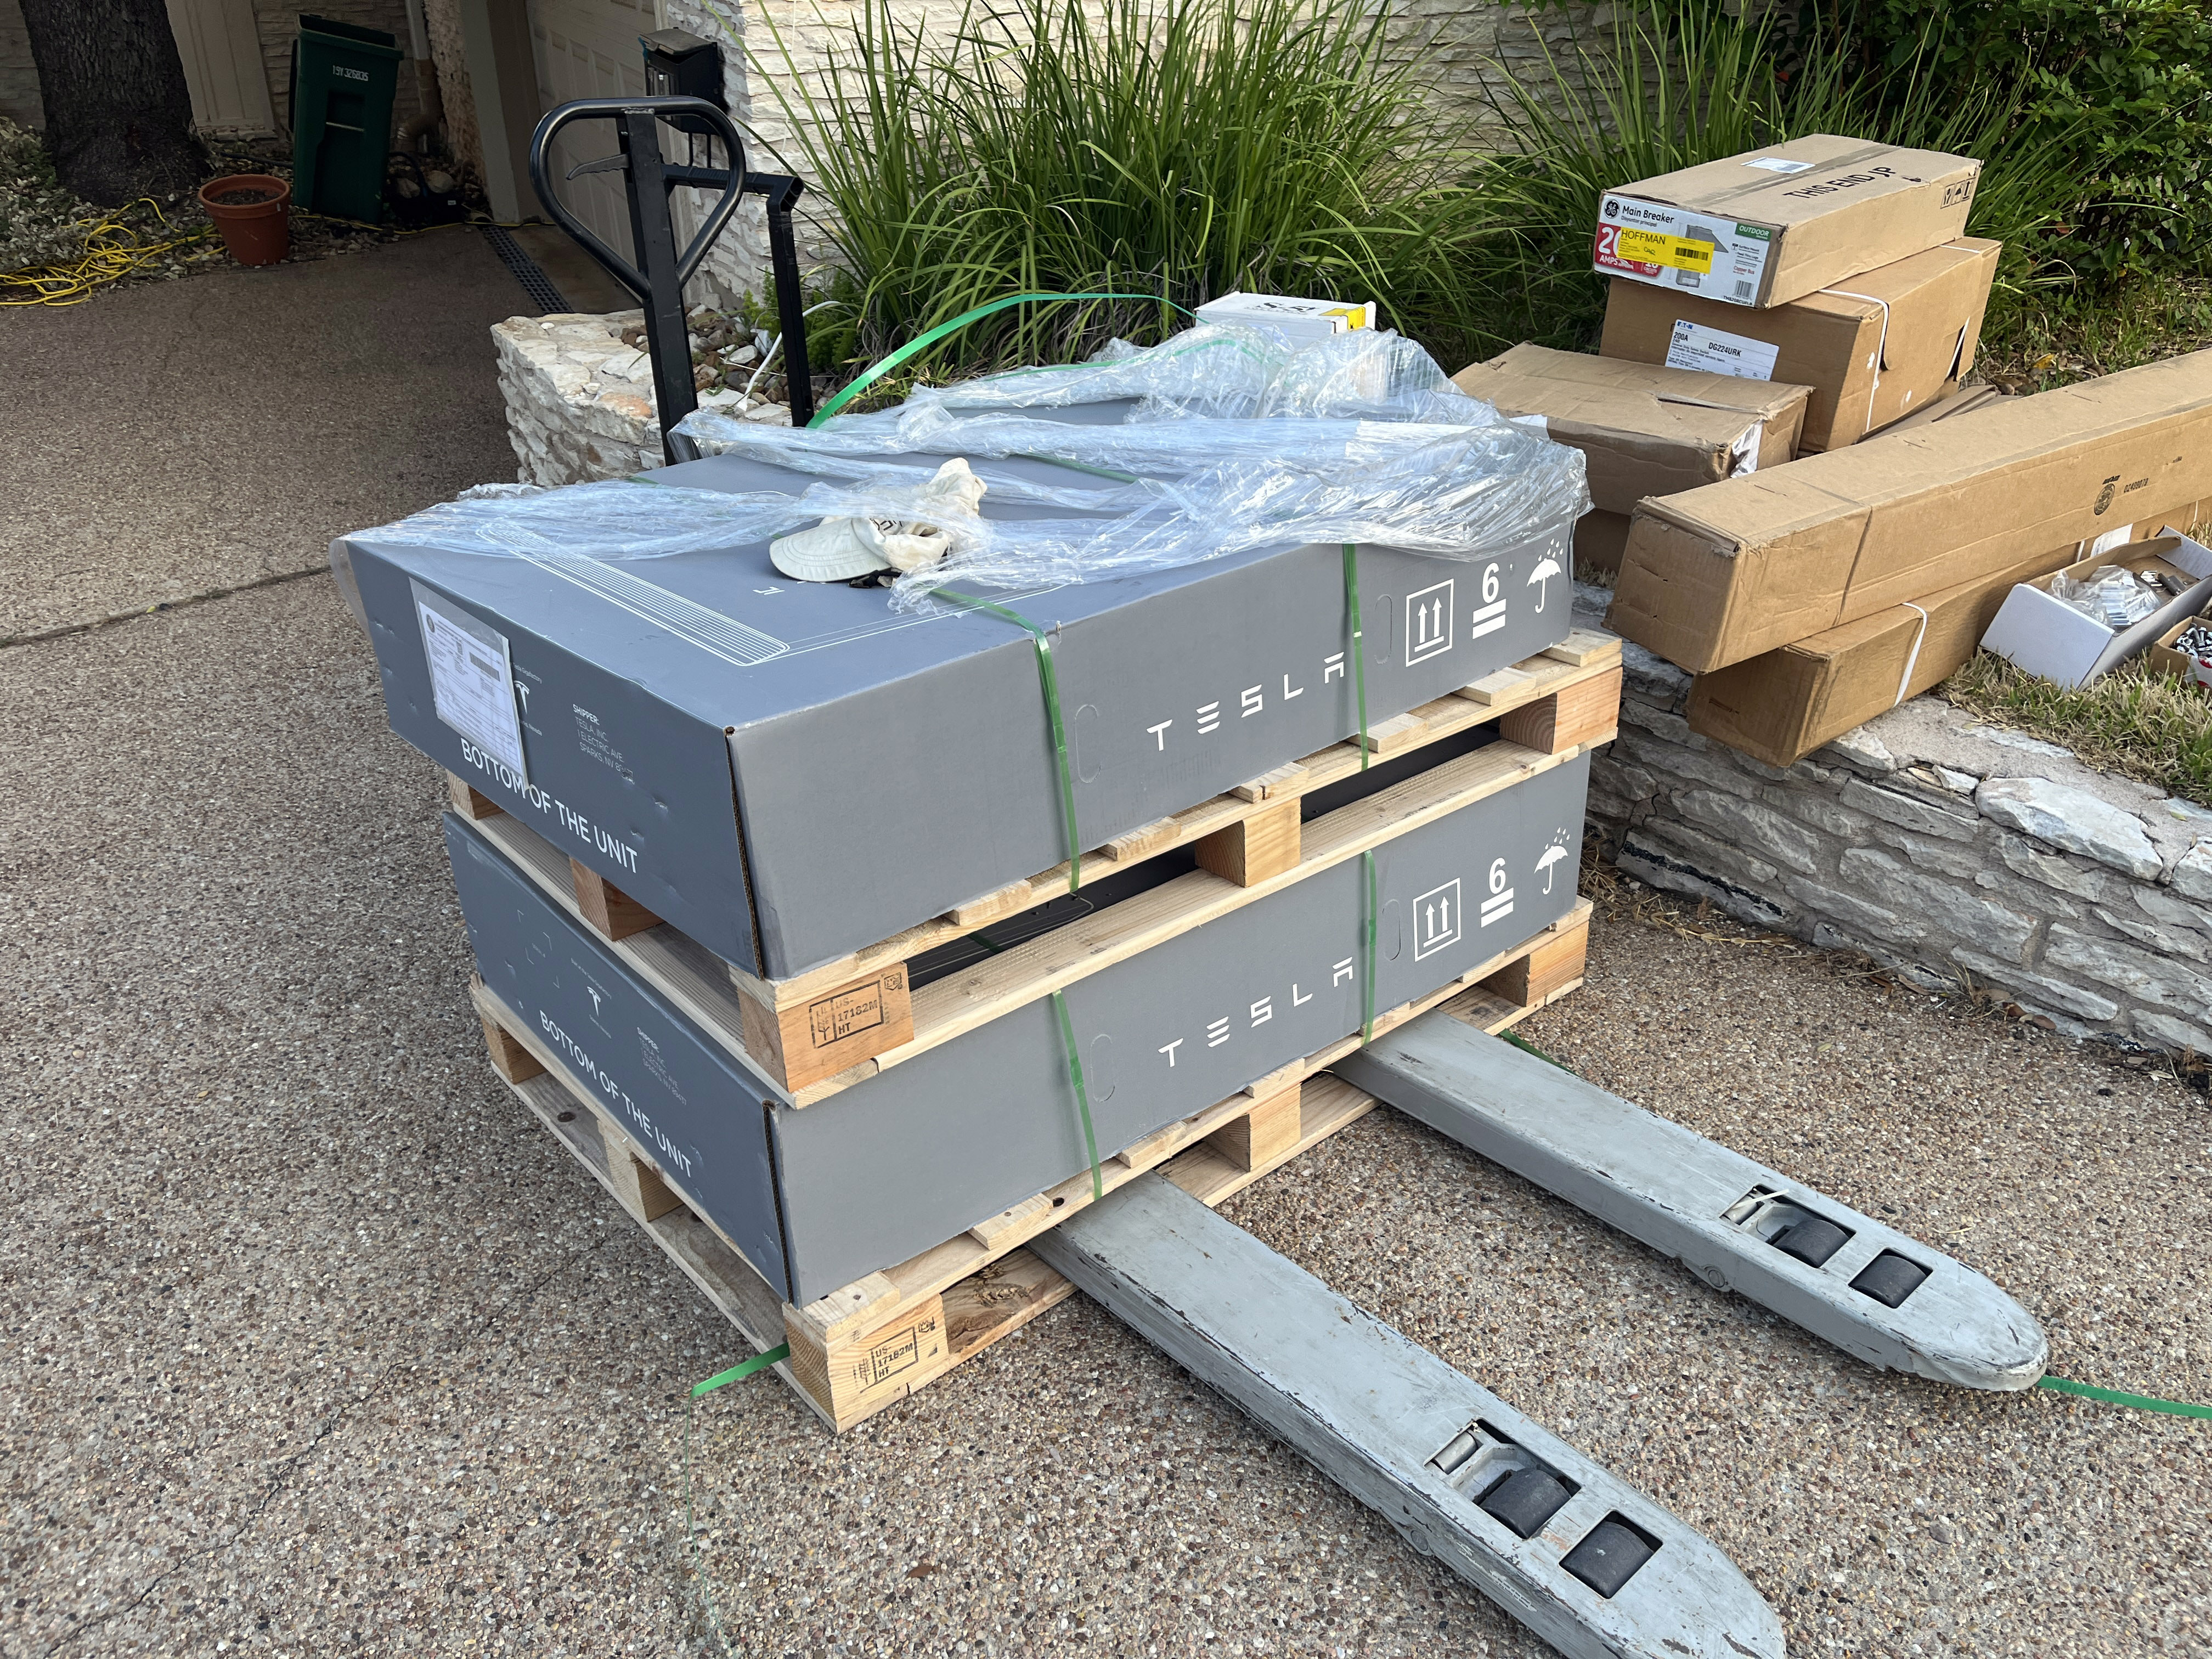
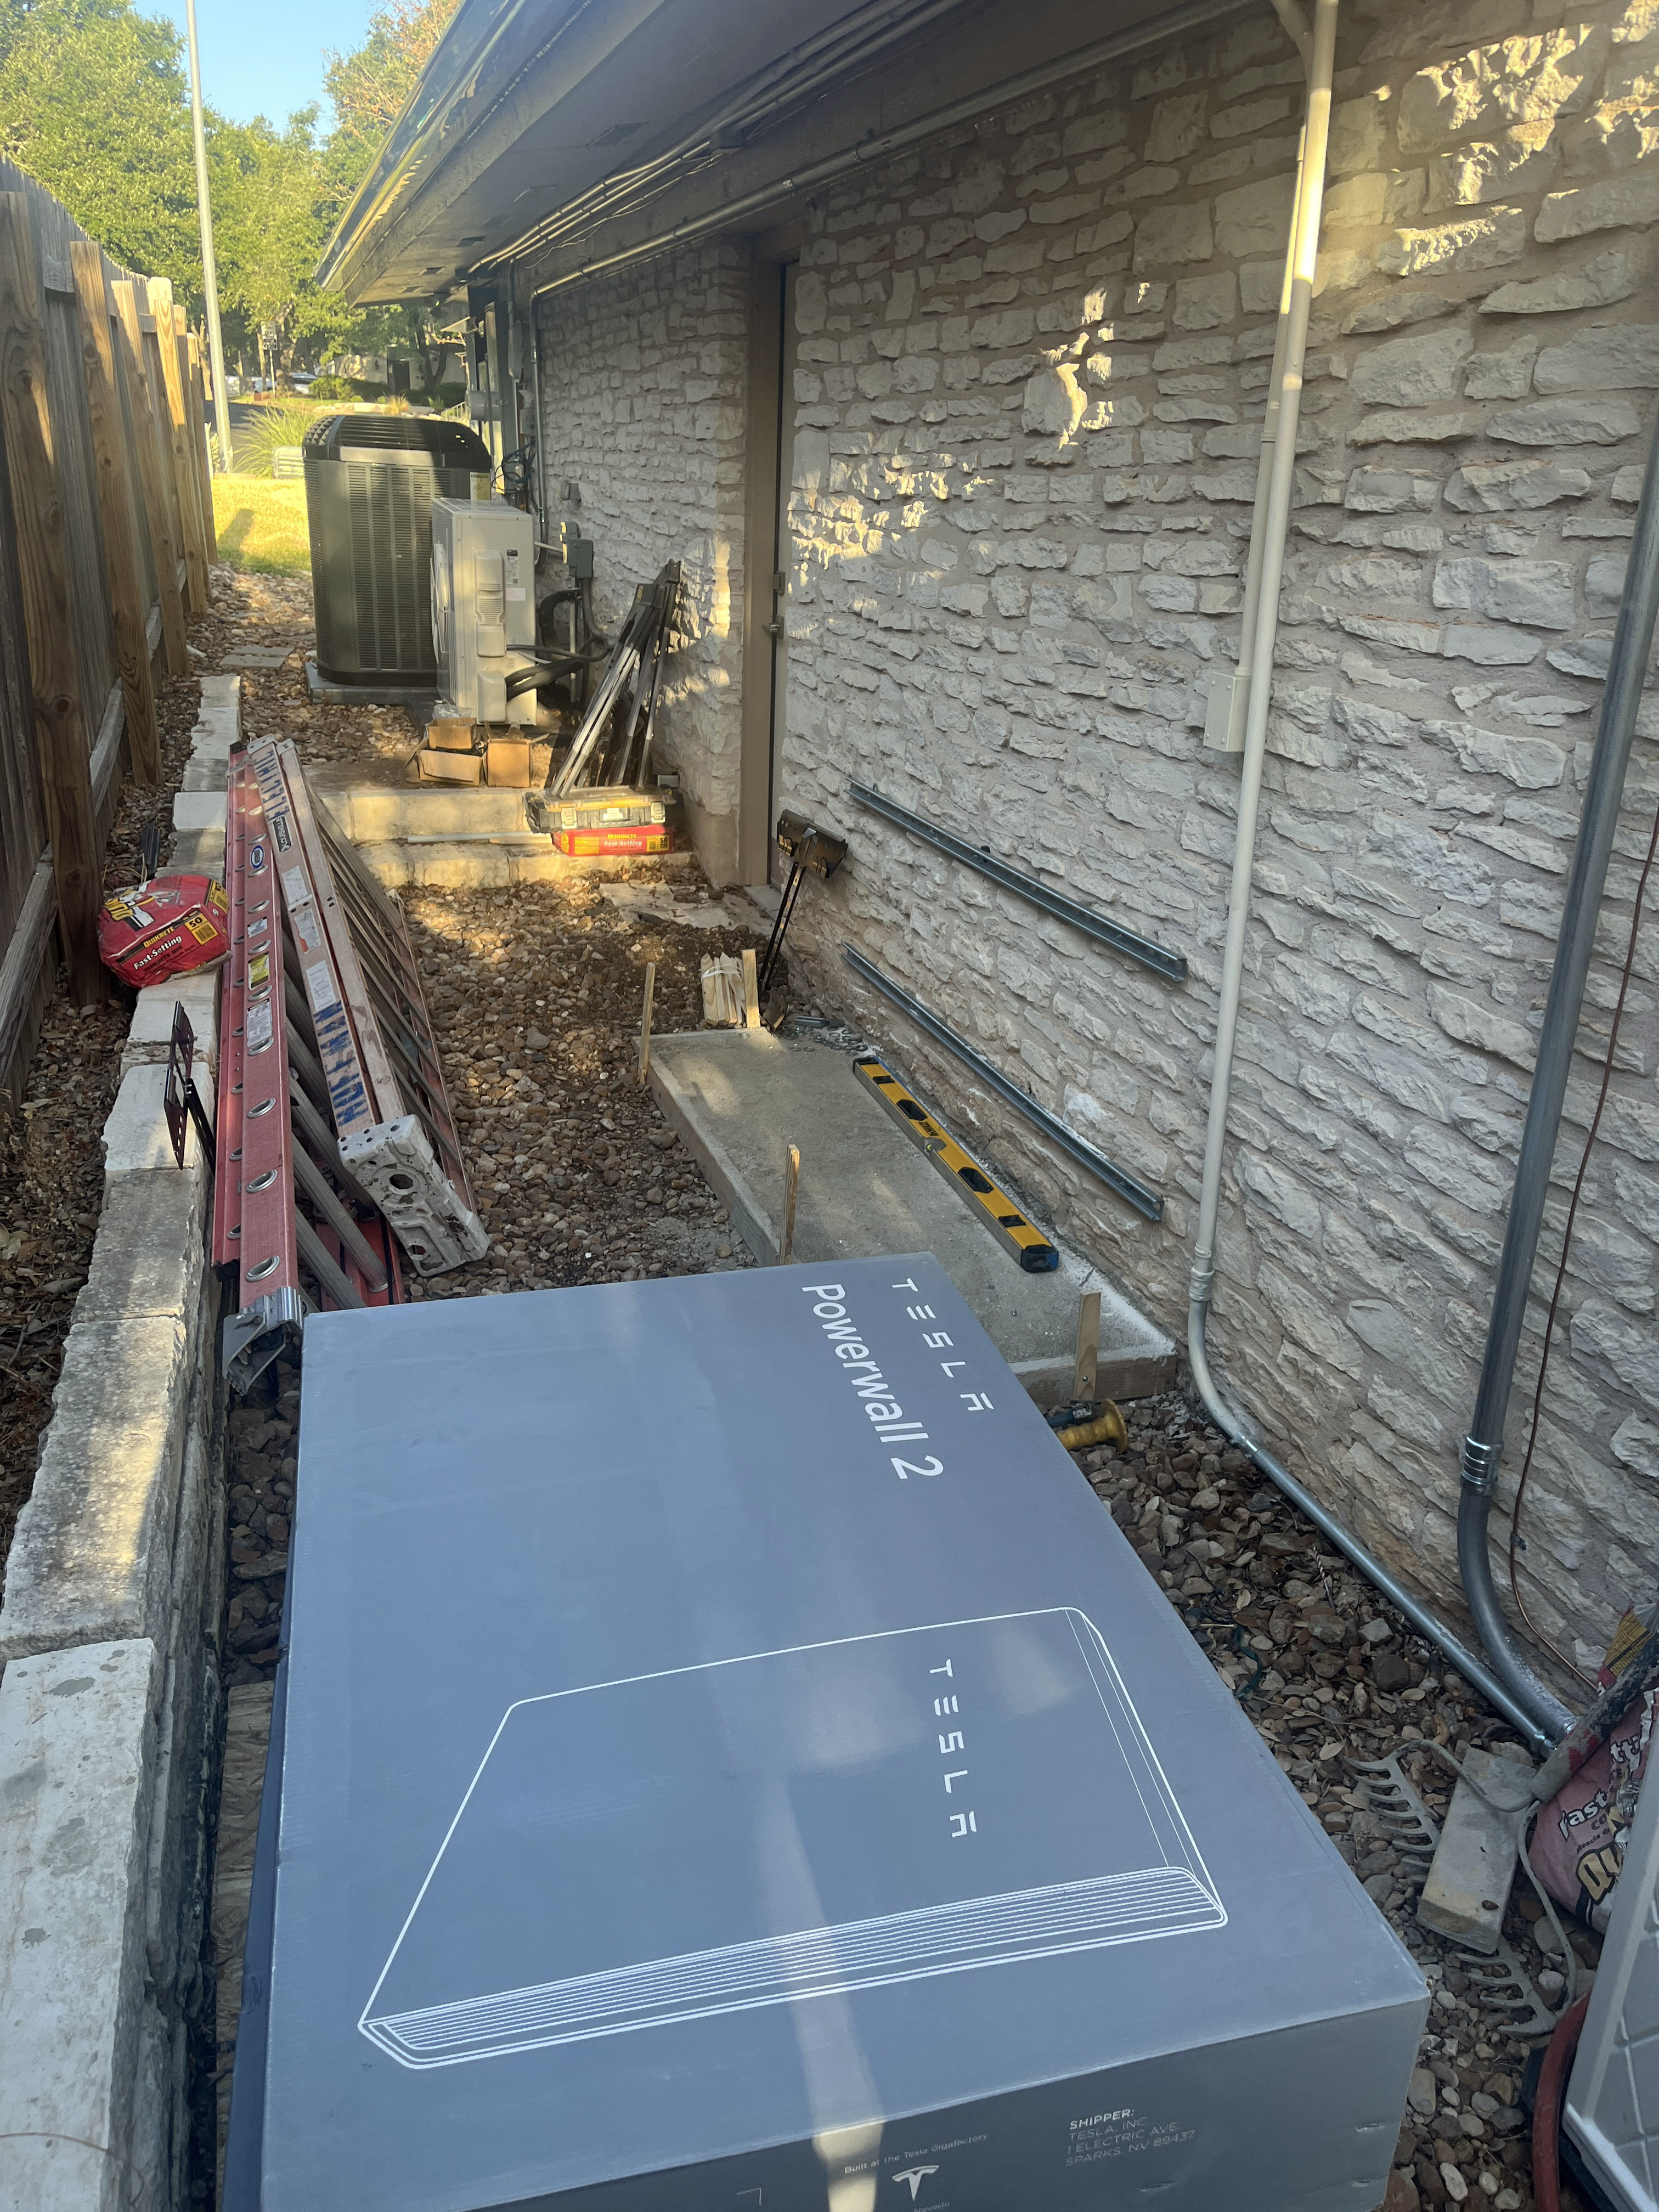
This is how Tesla Powerwall batteries show up at my house:
Here is the wall where the batteries will be installed. The first day the installers poured that concrete pad.
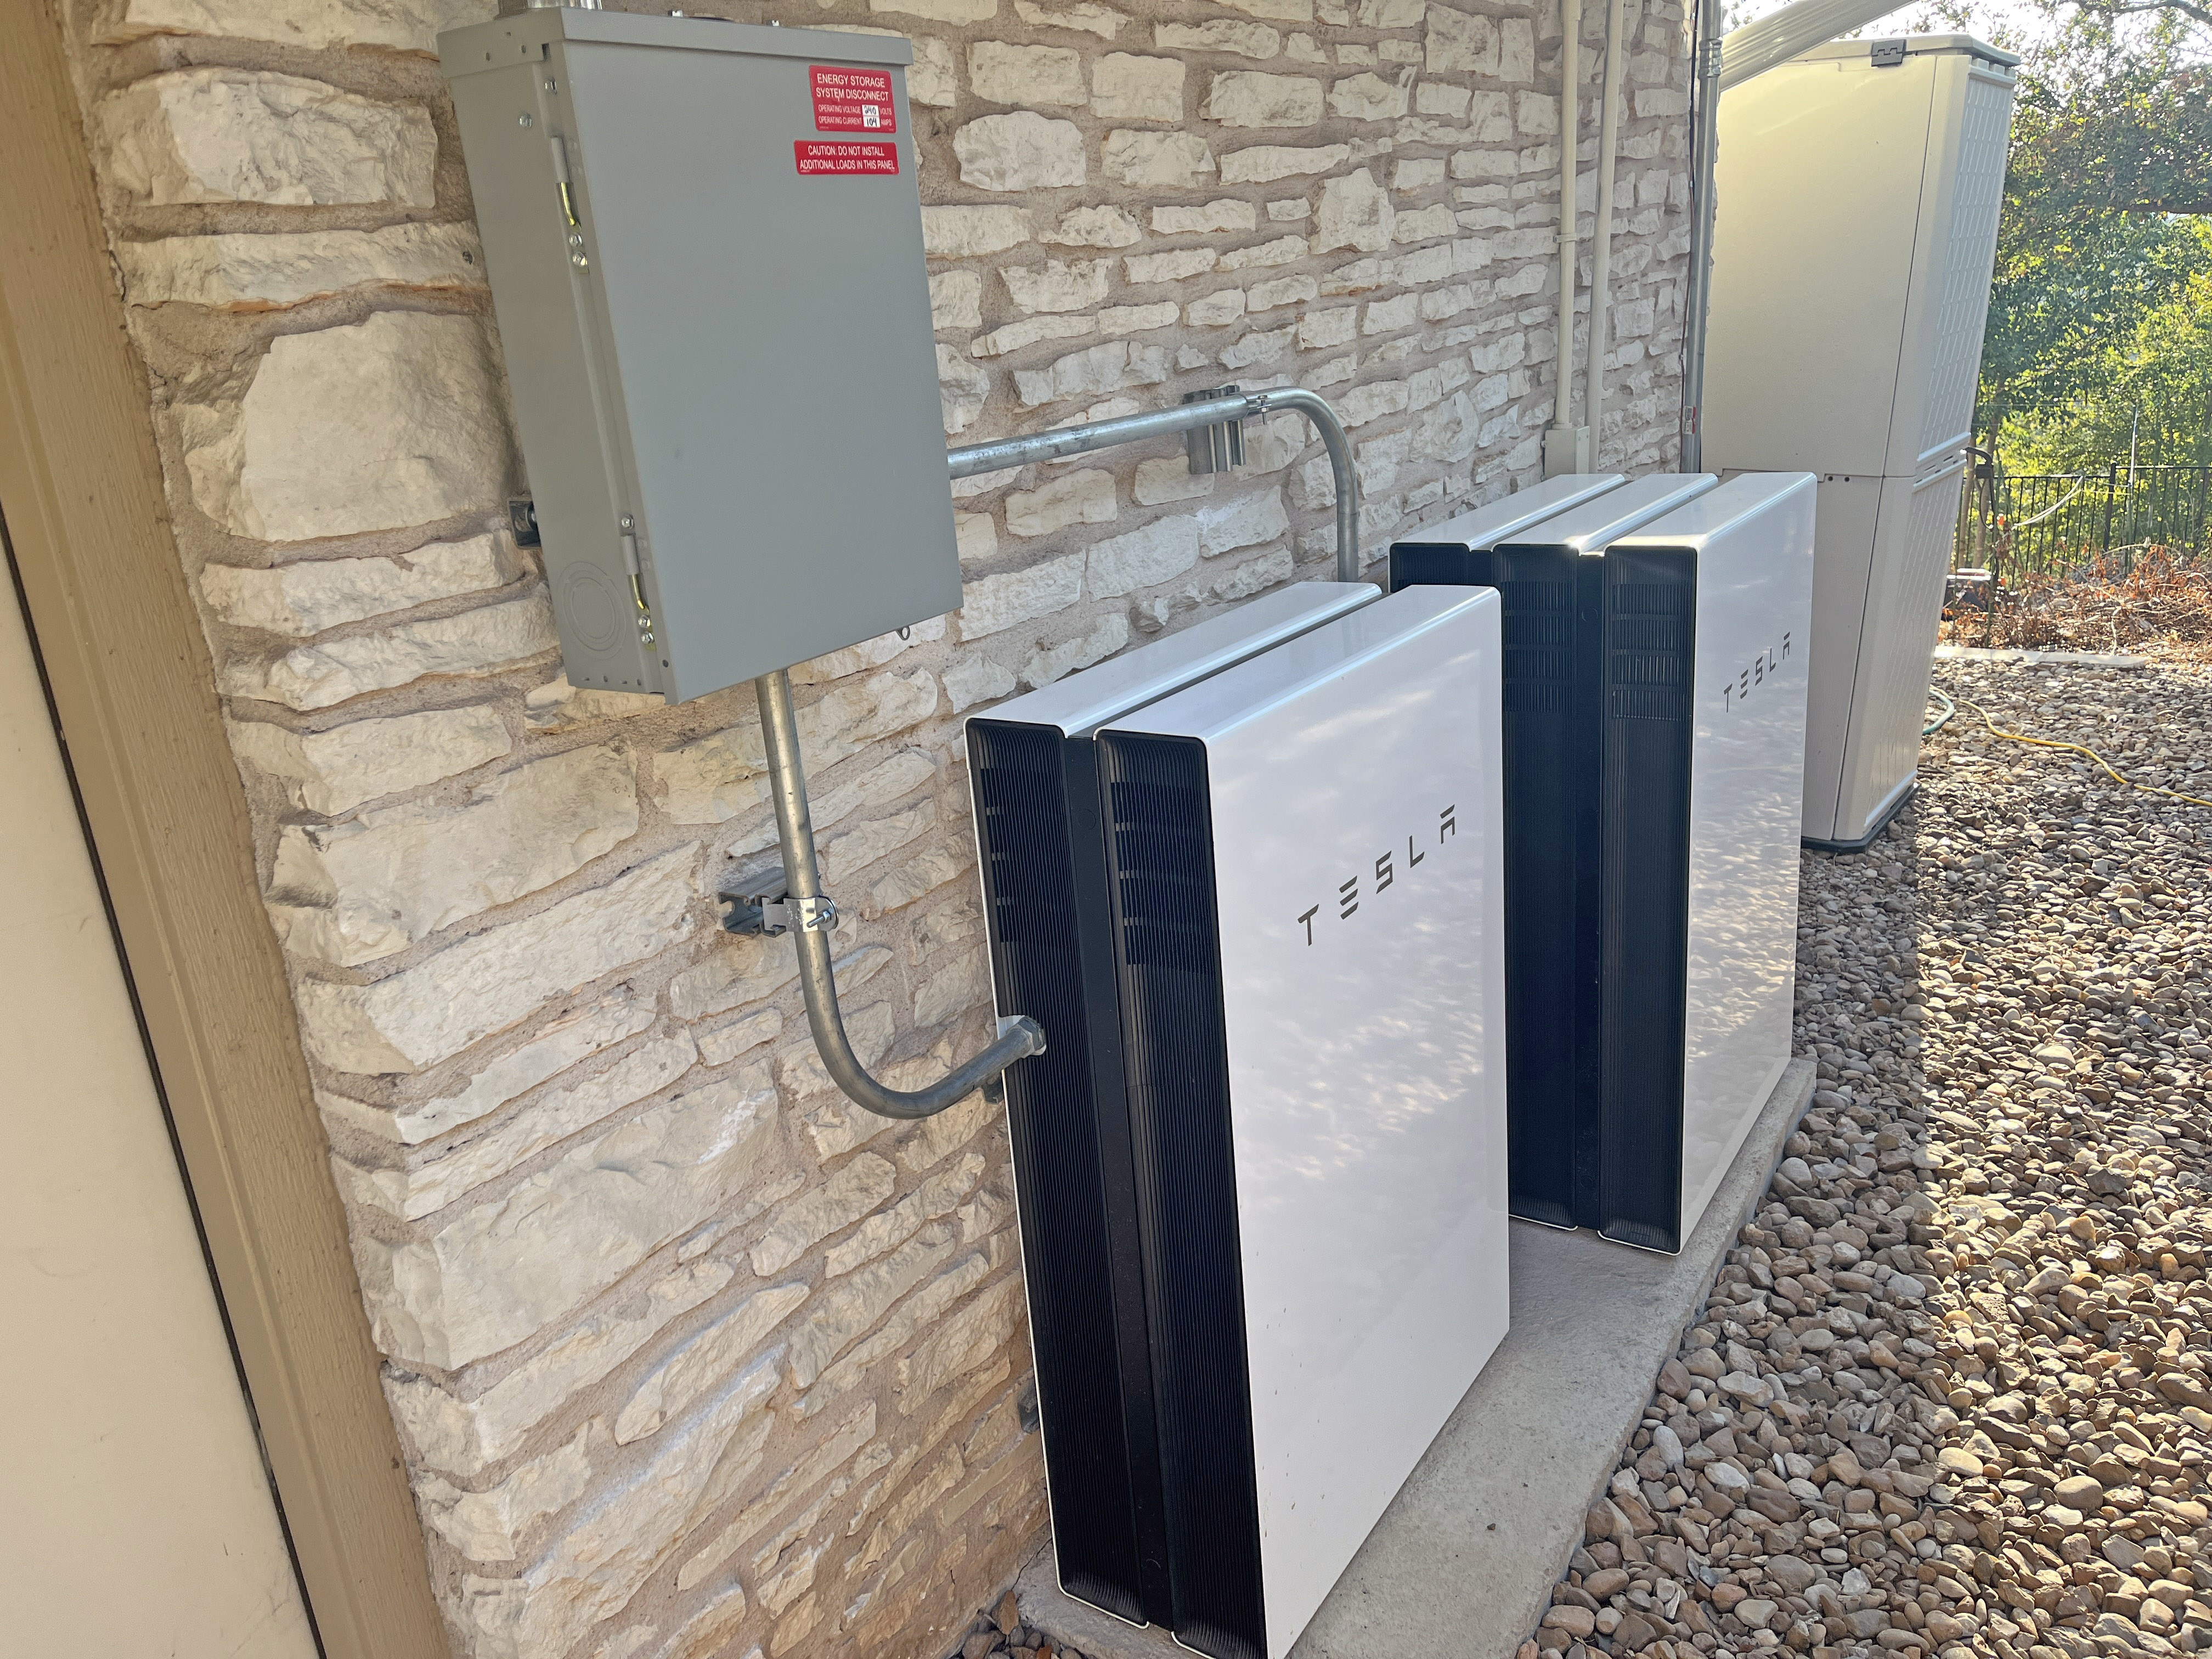
Here is that same concrete pad now at the final end of the install with the 5 Tesla Powerwalls on it.
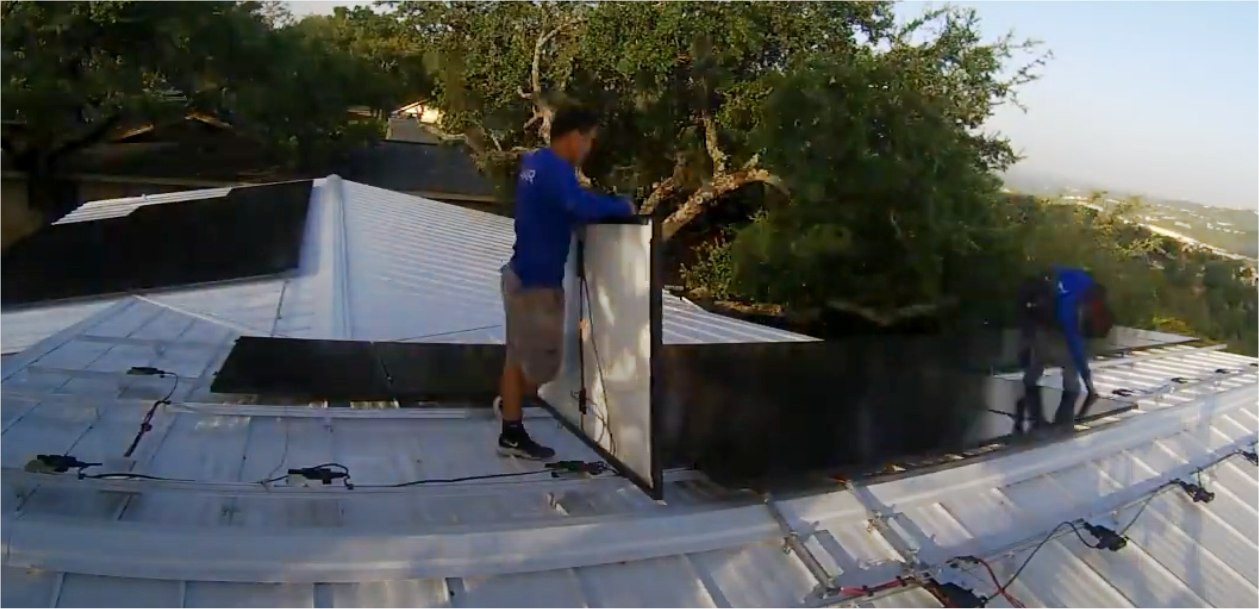
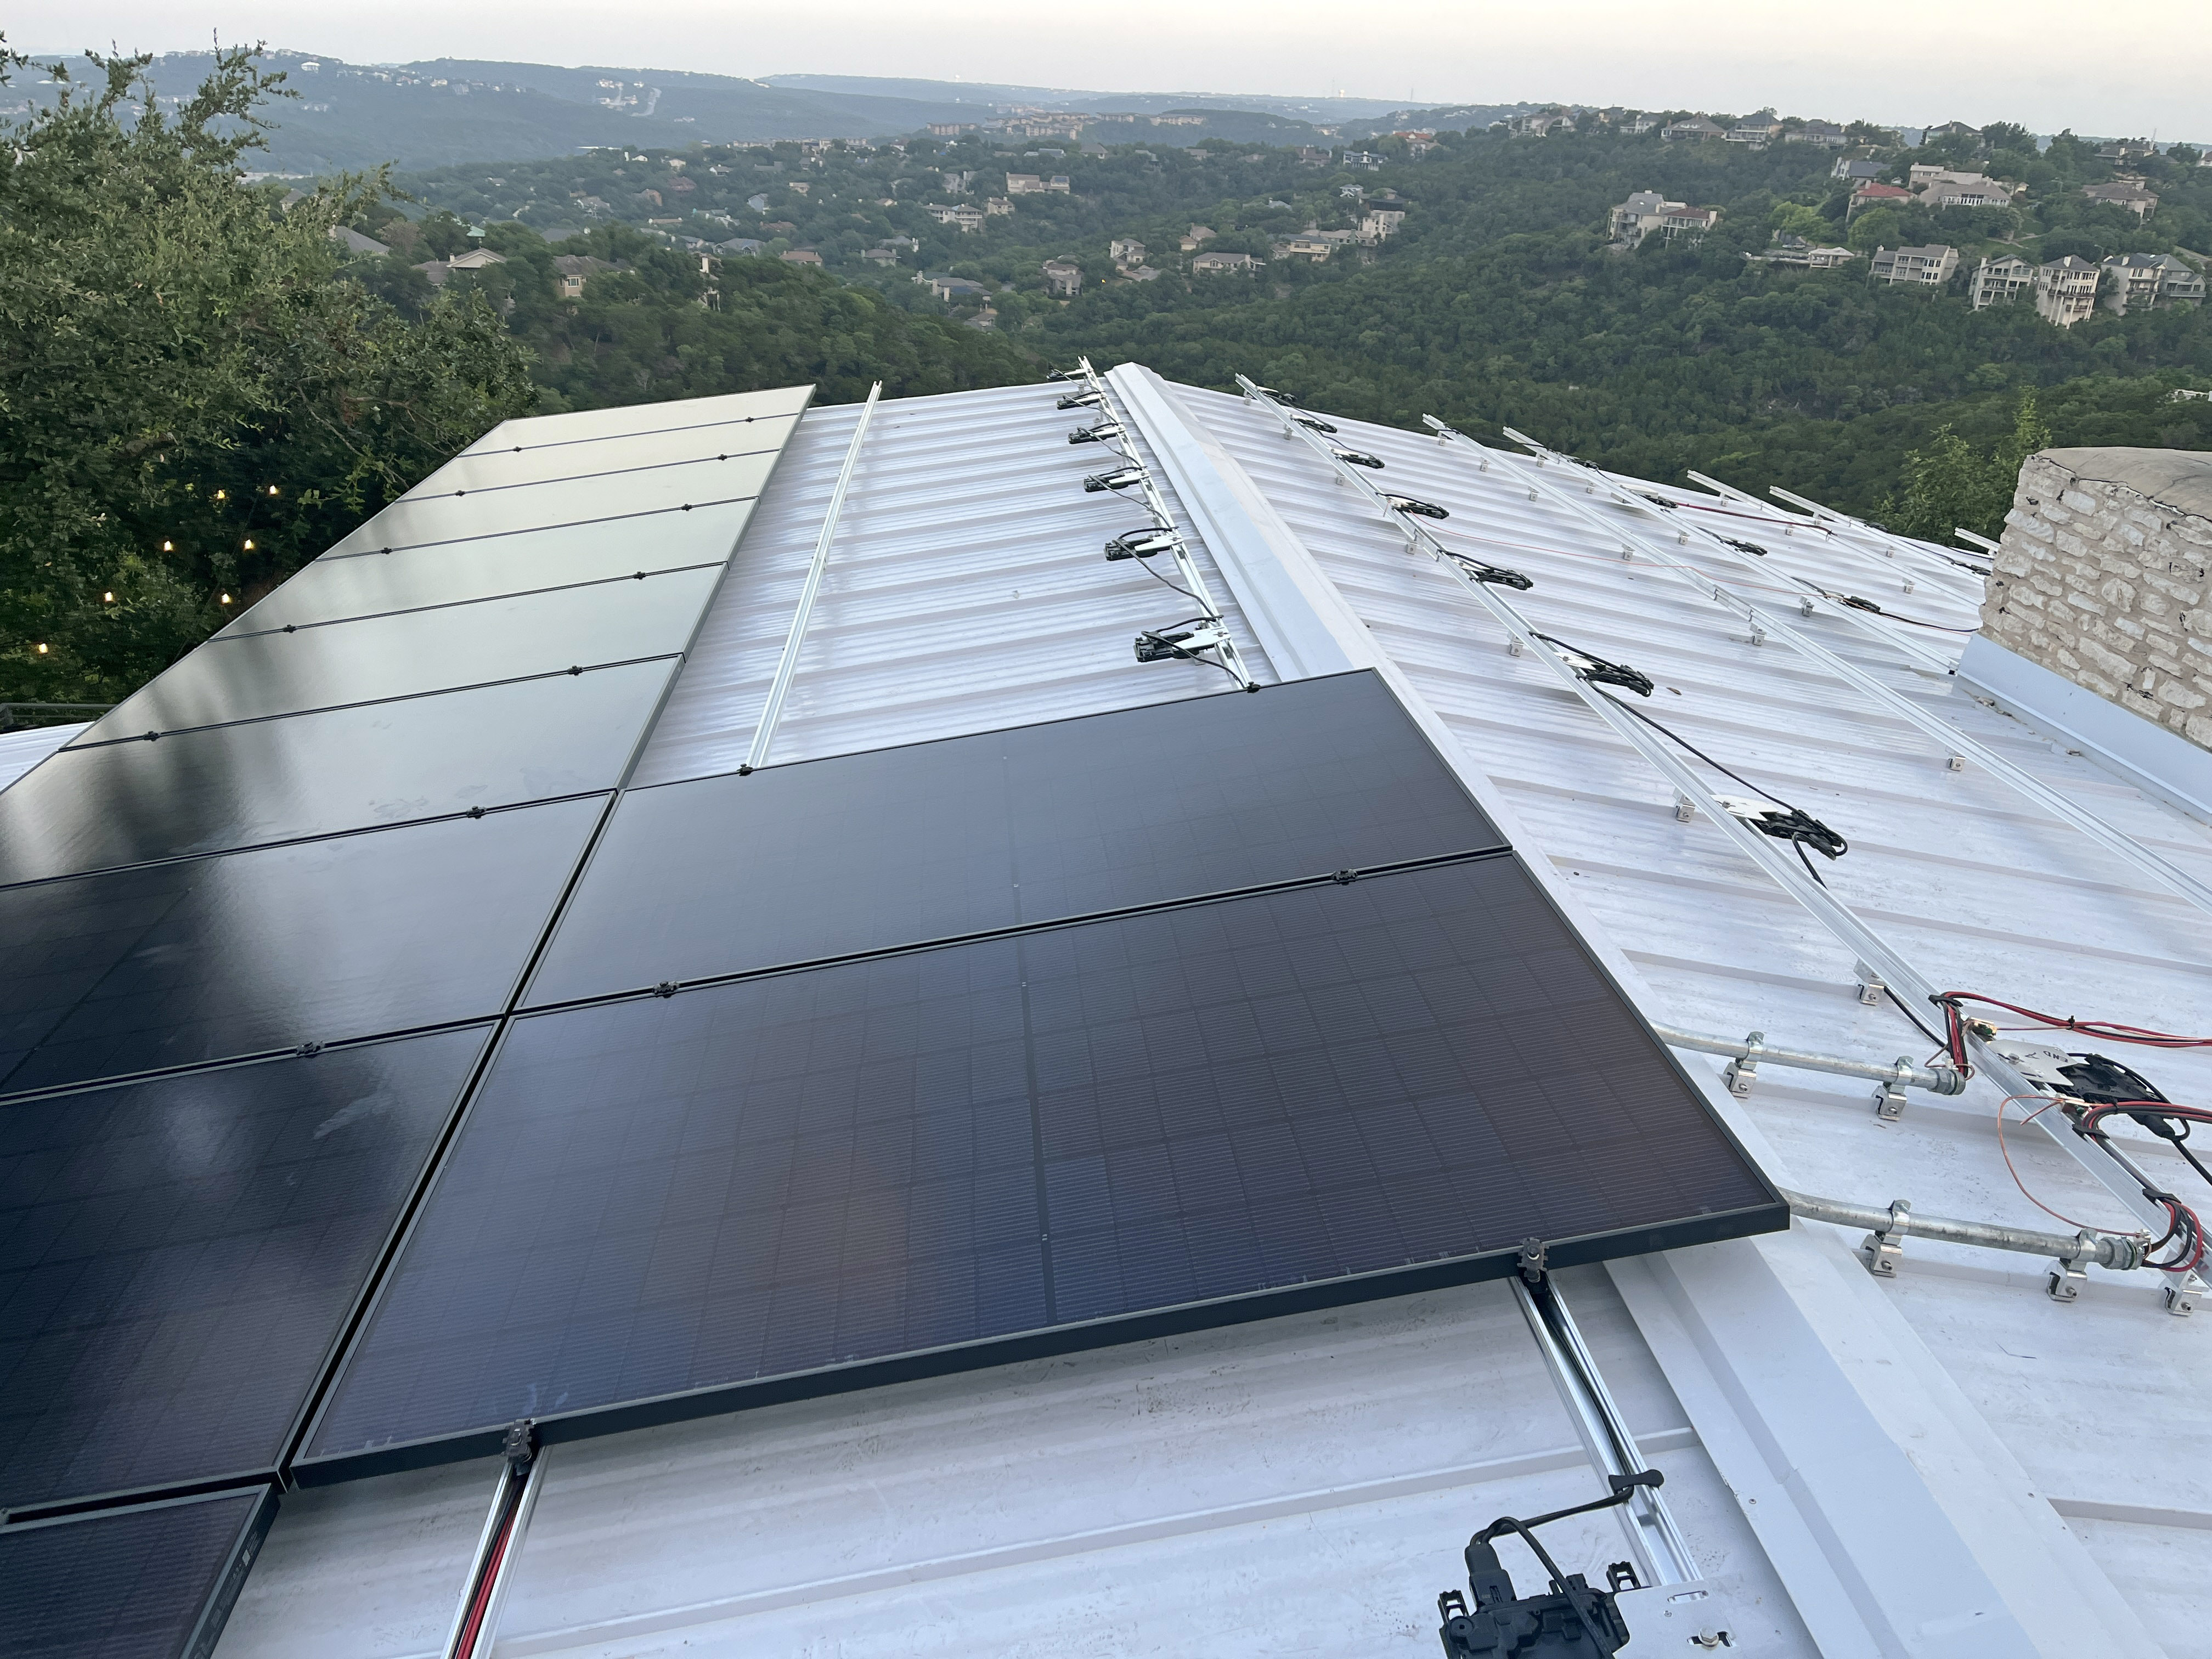
In the 2nd morning right before the installers showed up, I took this photo of the work partially done. It shows panels, inverters, and rails. The "clips" they use do not put holes in the roof. They clip to the metal ridges on the roof.
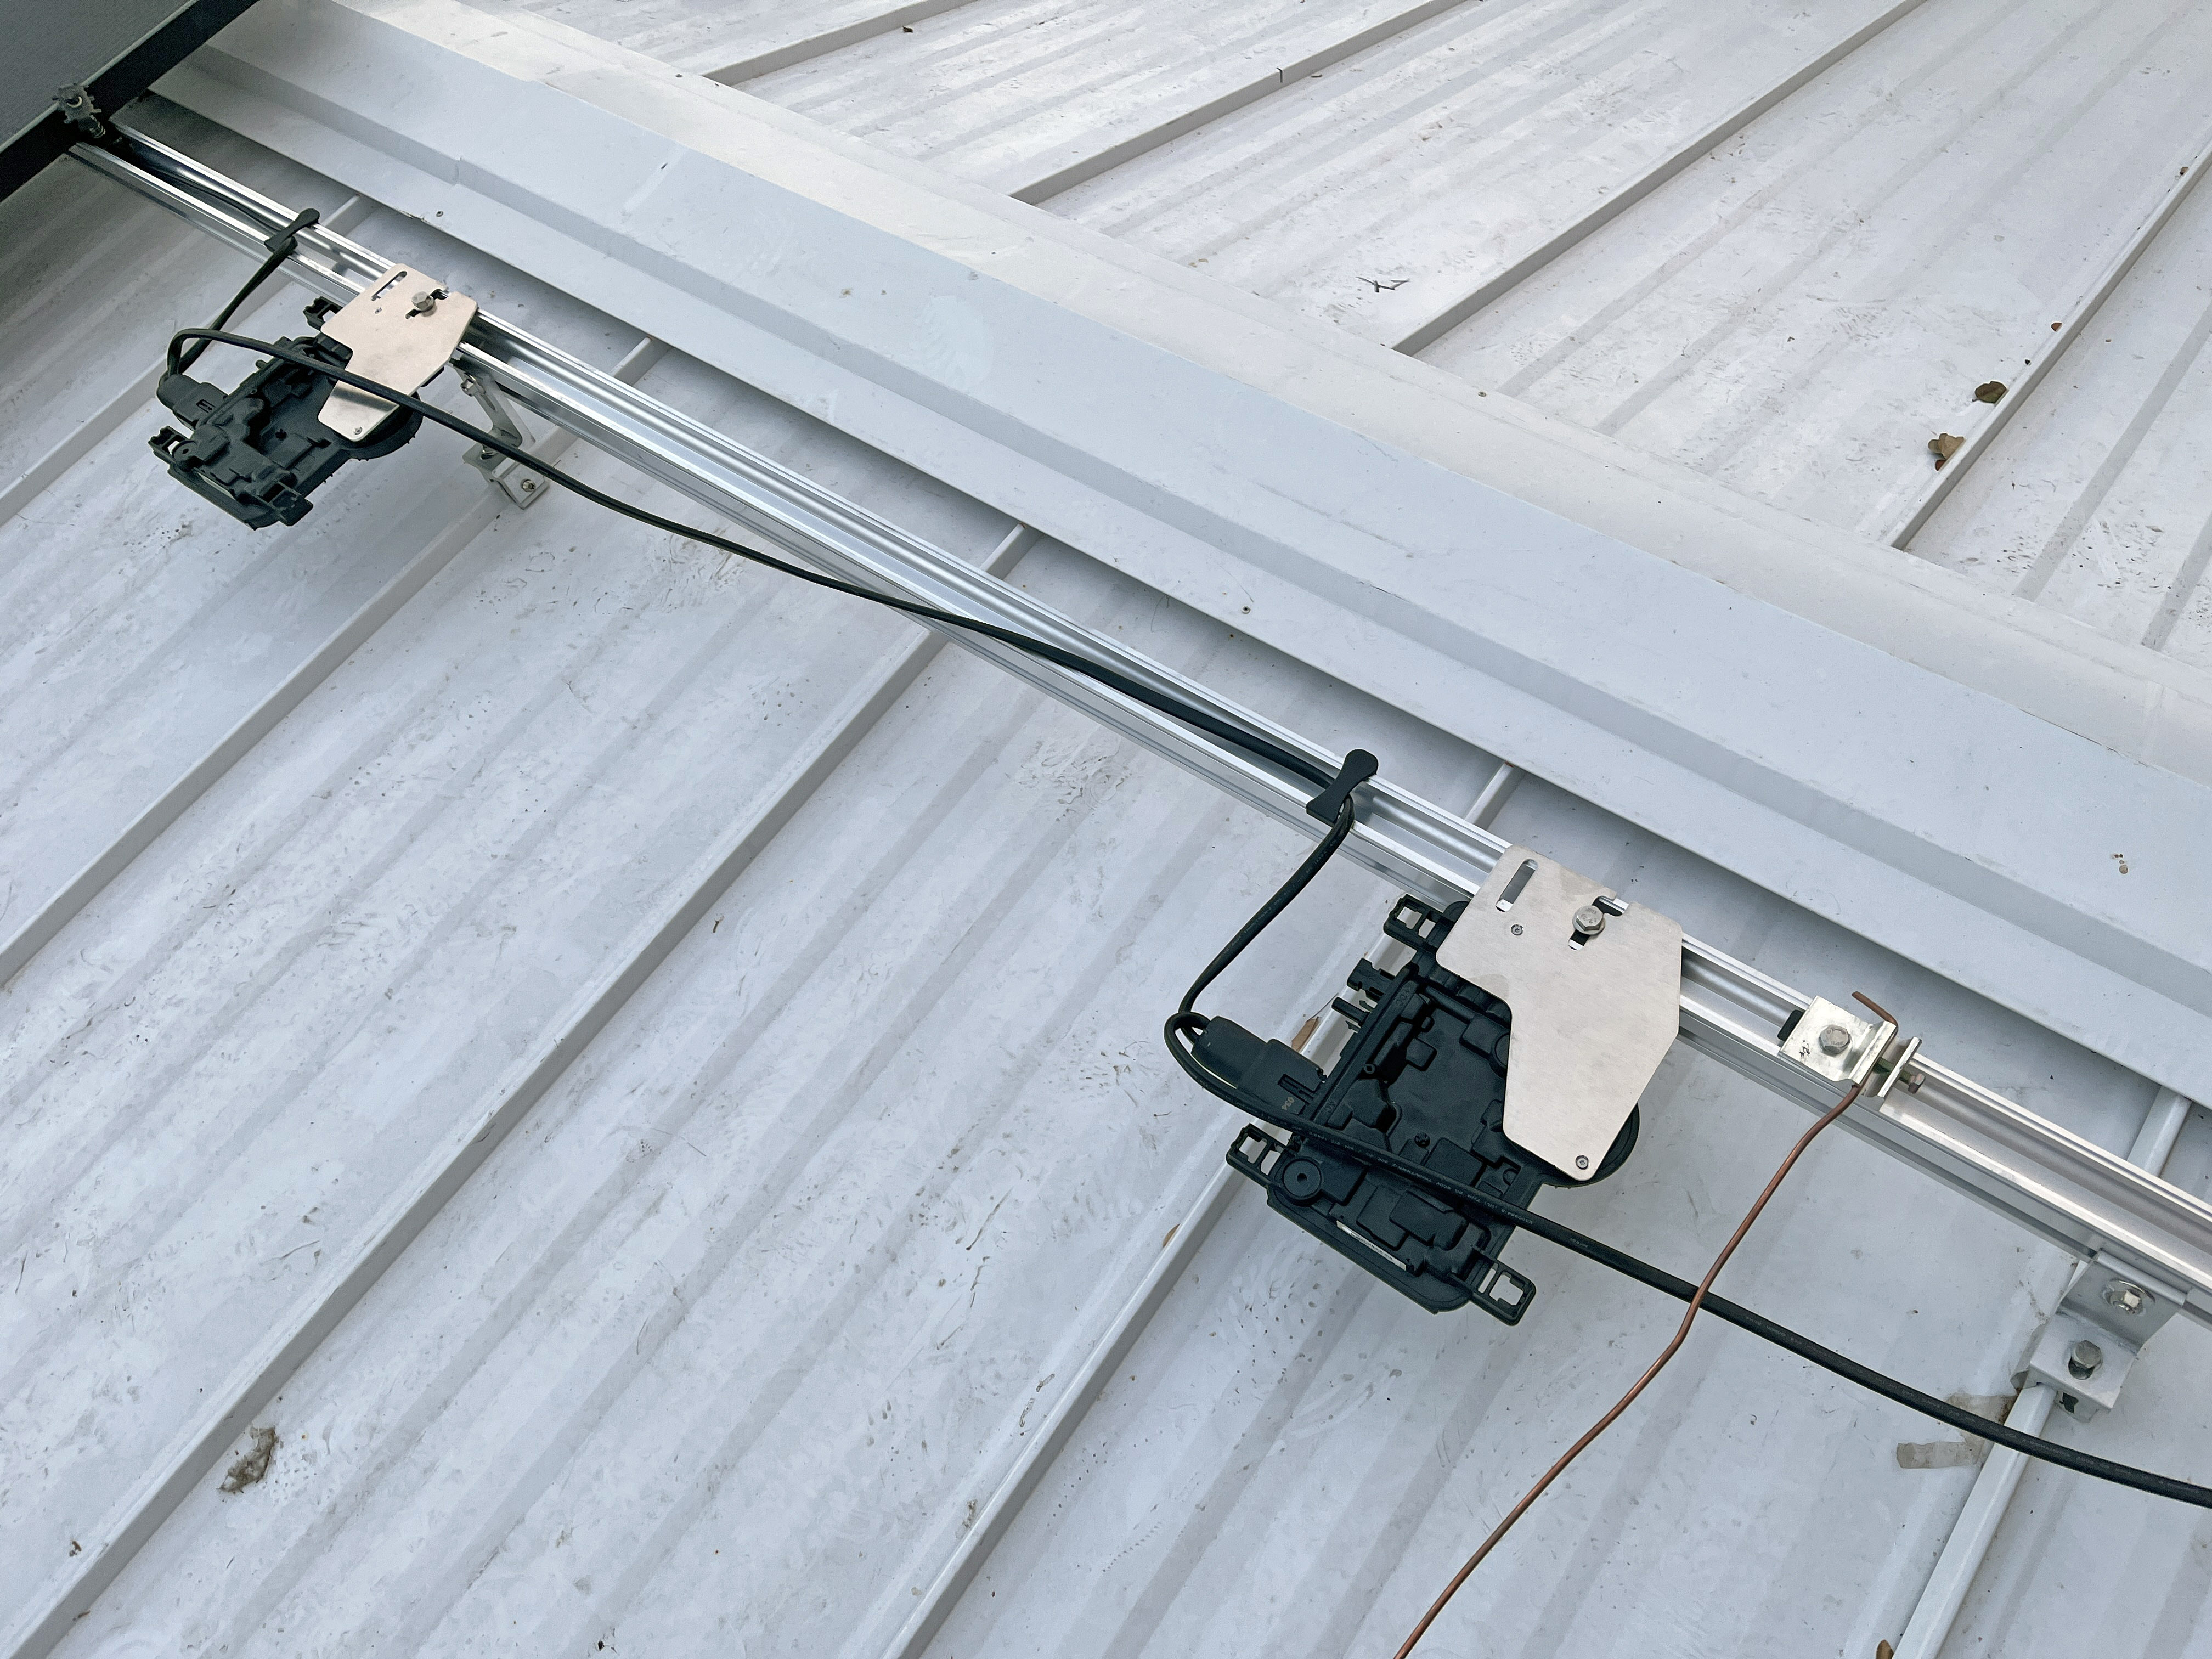
Below is a closeup of the IQ8M inverters and the rails they use to mount the panels.
Same moment in time, a little wider panorama.
This is the North facing roof.
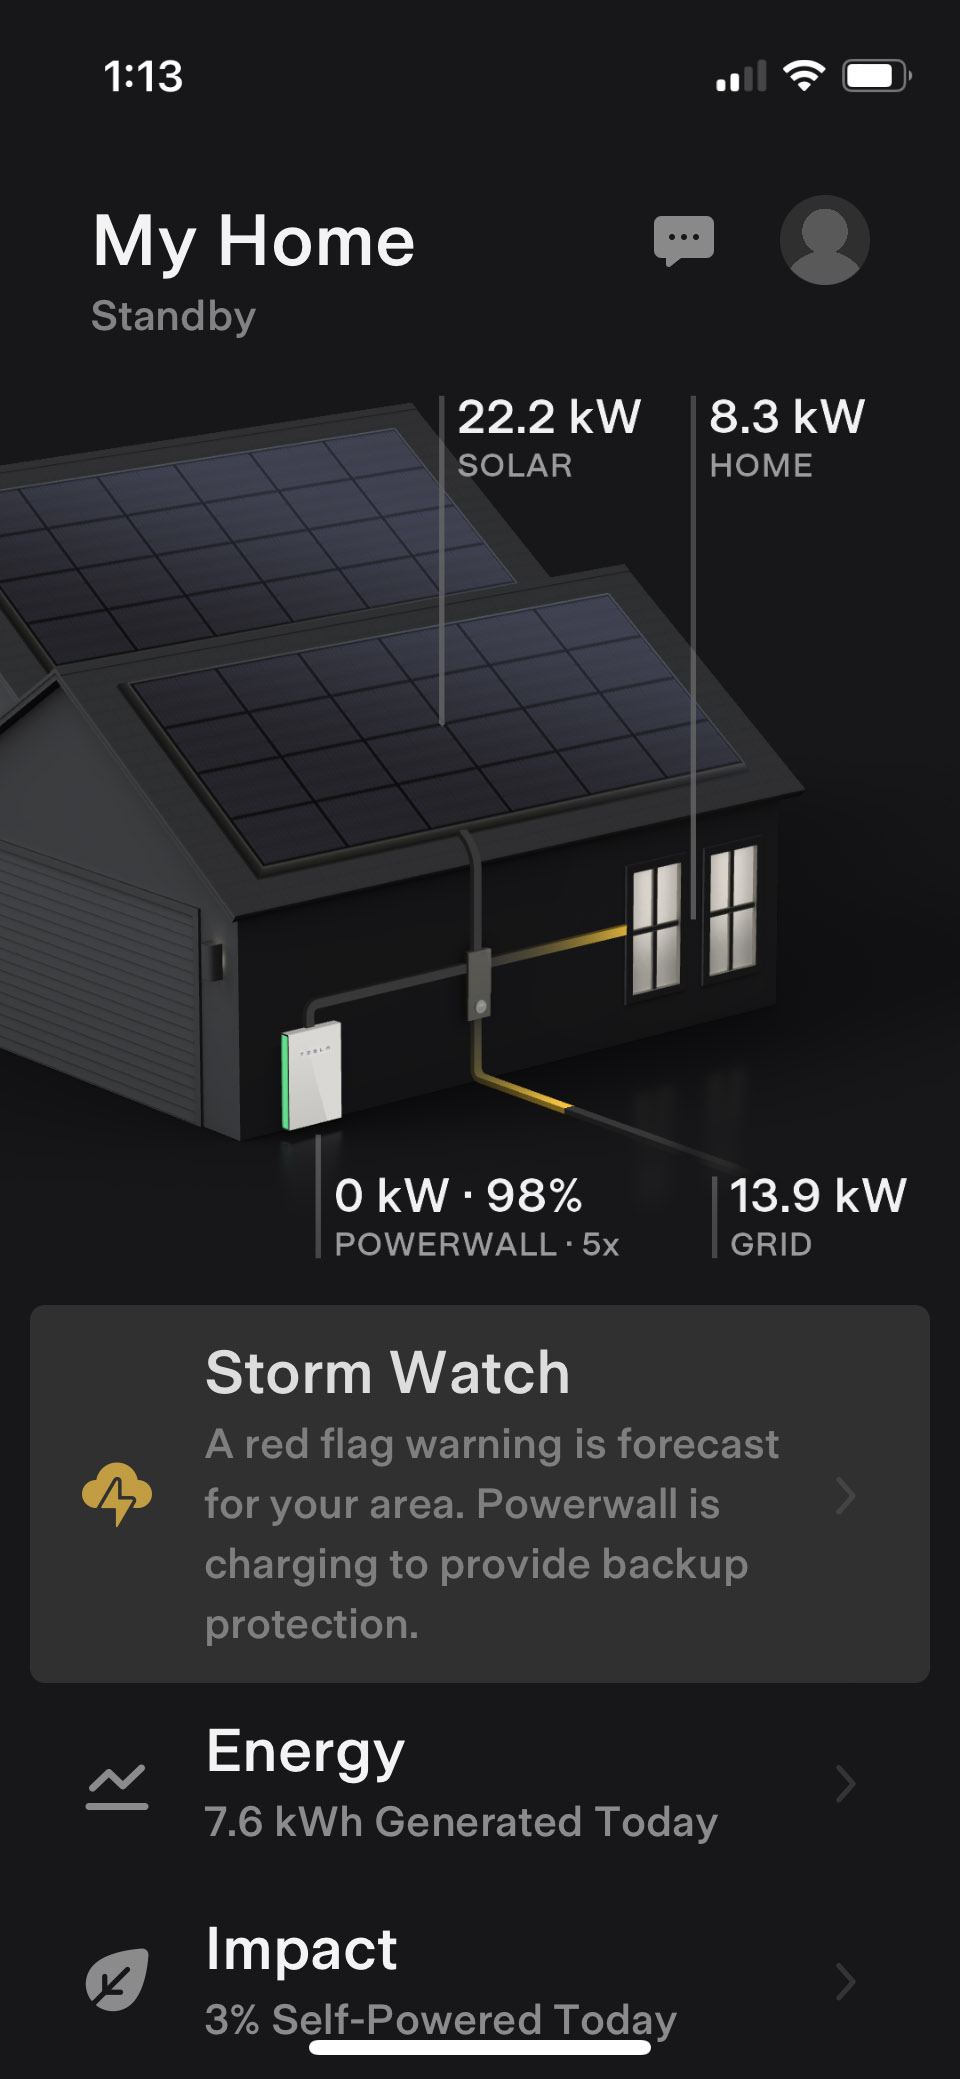
This is a screenshot from the Tesla App on my phone very soon after I was finally allowed (by the City of Austin) to power up the entire system. This is not the regular "steady state" yet because the batteries came with some charge and the system was sorting it all out.
Below is a more normal power flow a day later when everything stabilized. It shows the solar panels are producing 22.2 kW (three times as much as the house needs) and the whole home is using 8.3 kW. The excess 12.9 kW is being pushed into the electrical grid (I'm selling it the City of Austin at 9 cents/kWh.)
Below I caught an interesting moment. The Tesla Battery Gateway gets reports of when a "storm" might be near, and changes to fill the batteries to the top and won't use the batteries. This is to prepare for a possible power outage.
Ok, here are a series of screenshots where I scaled them and lined them up to show how the system works in a "normal" 24 hour period. Remember you can click on the image below for a more expanded "original" version. Explanation below the graphics.
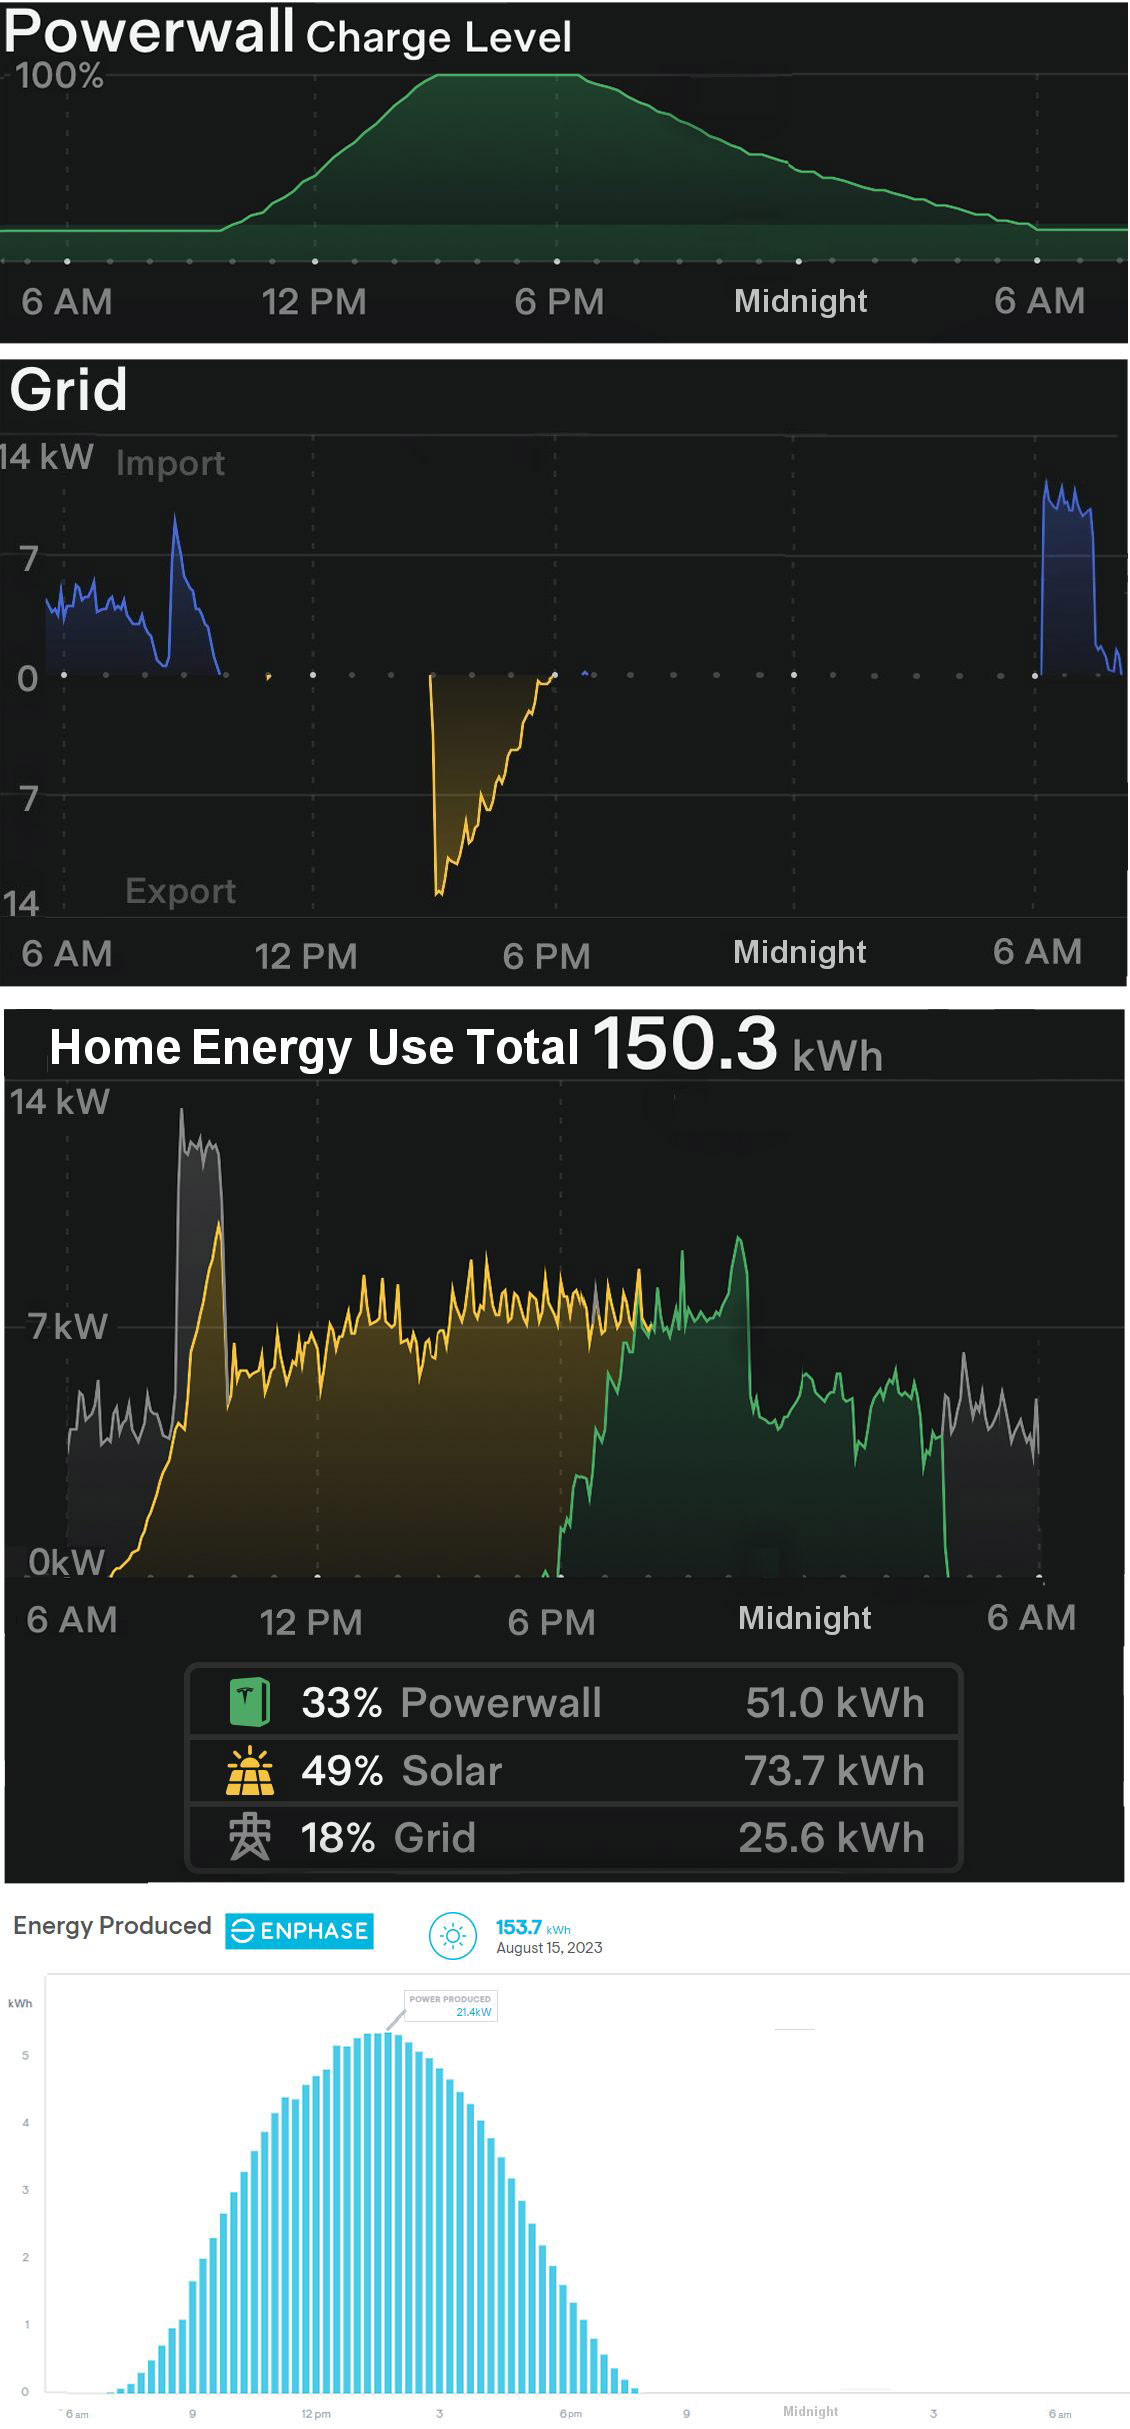
EXPLANATION of the above set of graphs: Okay, so the very top graph shows what charge the batteries are holding throughout the day. They charge up entirely from solar at the start of the day (the upward ramp starting at 10am), and at about 3pm the batteries are as full as they can be at 100%. At that moment in the TOP graph you can see the battery's charge flattens out at 100%. During that time my house is running off of solar, no grid, and no batteries required. So looking at the second graph down, at that same 3pm suddenly instead of charging solar, all the extra electricity is being sold to the City of Austin, pushed back up into the power grid for others to use (shown in yellow in the second graph). That happens to start at 3pm pretty much the peak moment the house solar is producing the most power, so it is very sudden in the second graph, then slowly tapers as the sun sets.
There is no longer any "excess" power at about 6:30pm. The solar panels are producing exactly what the house needs at 6:30pm, so from that point onward the batteries supplement (as the sun gets weaker and weaker) and in the top graph you can see from 6:30pm onwards the batteries discharge about linearly powering the house. During this whole time (until 6am) I am not using any power from the grid at all, the house is totally self sufficient and entirely on solar and batteries from about 10am until the next day at 6am. So right now I only ever need the grid for 4 hours a day, and those 4 hours are 6am - 10am.
At 6am the batteries hit 16% remaining charge. That is the "default" minimum charge level where the system changes modes and that 16% is "reserved for emergencies" like a power outage. So starting at 6am the system begins running the house off of the electrical grid. This continues until the sun rises and the solar panels produce enough energy alone to power the house.
The last graph in blue is all 100% related to the solar panels, and this graph doesn't care where the power from the panels is going (battery or grid or house are not important in this graph). The blue graph at the bottom shows the hours that the solar panels produce any electricity at all and how much, regardless of any other part of the system. It shows that on a blue sky August day in Austin, power generation peaks at 21.4 kW (for this particular solar array) between 2pm and 3pm. I've seen other solar production charts from roof-top solar, and this curve is what they all look like as long as there are no clouds.
VERY IMPORTANT: I SELL power to the electrical grid for about 3 hours each day, from 3pm - 6pm. Then I BUY it back for 4 hours from 6am - 10am. So I'm effectively using the power grid as a place to store excess energy and the whole system approximately results in a $0 "net" electrical bill. I believe with one more Tesla Powerwall I would not need to use the electrical grid in this way (I would only ever use my own batteries to store power), and I could unhook entirely from the electrical grid. This is called "Grid Defection" and it is what I plan to do after gaining experience with the whole system.
What About During the Winter Solstice?
All of the above was pretty much "best power generation situation" in the
summer, and also peak air conditioning in the hottest summer Austin Texas has
ever seen. Here is what two days around Winter Solstice look like for
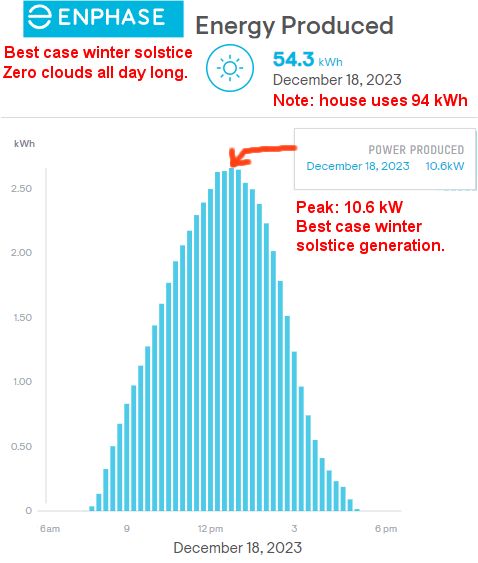
power generation. The first graph is a clear blue sky all day long.
You can see it only produces 54.3 kWhrs total all day long (best case scenario
winter solstice) compared with 153 kWhrs generated in the longer days of summer.
And the chart below is a couple days later when it was totally overcast all day long:
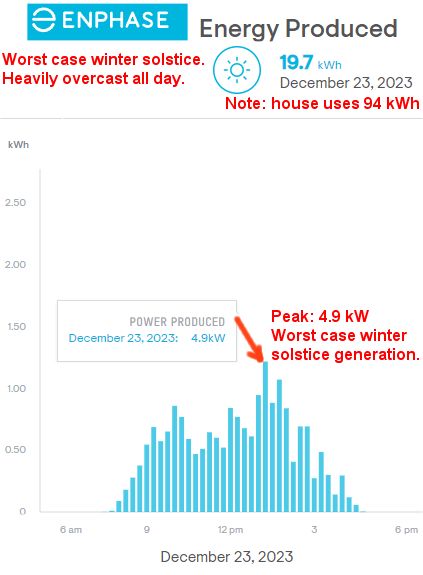
Discussion: those totally overcast days are fairly rare for Austin. It is probably required (and Ok) that I have a natural gas generator for those days. But the "best case winter solstice" generating 54 kWhrs while the house uses 94 kWhrs isn't good enough. If I had twice as many solar panels (so overbuild the system) it would be pretty close to supplying all my power needs year round. The house battery pack needs to be 20% larger for the hottest summers, and I need more solar panels (but not more battery) for the winter months. Now the other thing working against me is the trees are throwing more shade on more panels in the winter. I did all the tree trimming based on shadow patterns from summer. But I can trim the trees more in the future.
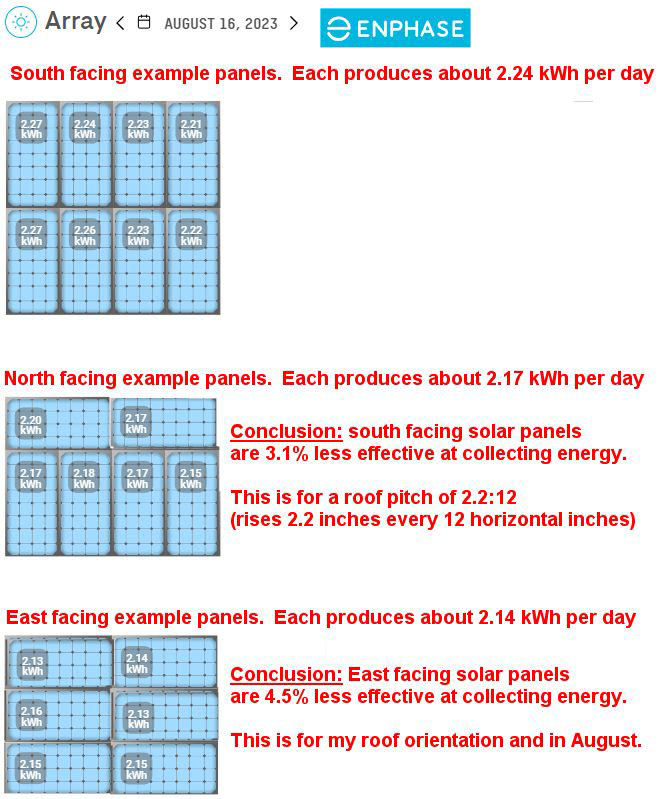
What is the Different Output of Individual Solar Panels Based on
North/South/East Facing On Roof?
If you take a look at the sampling below, it is for a roof that is pitch of
2.2:12 which means the roof rises 2.2 inches for every 12 horizontal inches.
The numbers on each panel are the amount of kWh of energy collected in a 24 hour
period. The most effective position for the panels is facing south because
that faces the most sunlight at the best angle. Each solar panel facing
south collects about 2.24 kWh per day.
I found it most interesting that the panels are only 3.1% less effective facing north! And only 4.5% less effective facing East. This implies all I need to do to compensate for a any sub-optimal roof orientation is (worst case) add exactly 1 extra panel for every 20 solar panels not facing south. UPDATE on Winter Solstice: there is a much more pronounced drop of closer to 20% based on roof pitch when the sun is low in the sky and the days are shorter.
A rough early calculation of how I could add an "off grid" system with solar panels, move some circuits onto that off grid system, and no longer EVER sell power to the power company and "grid defect":
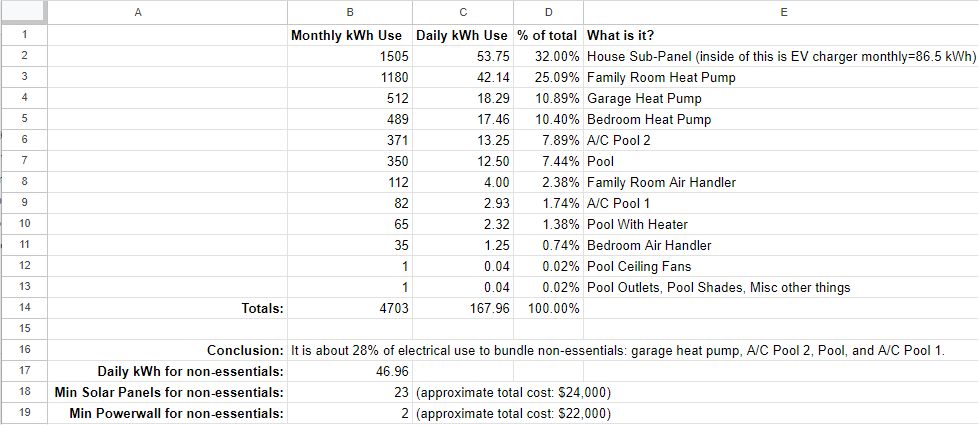
So building that system is pretty doable, and I unplug from the electrical grid. I would replace the EXACT connection that currently goes to the grid with a natural gas powered generator. Natural gas flows more reliably then electrical power. This would be a backup if I even dipped below what the batteries can provide. Let's say a once per year snowstorm that covers all the electrical panels for two days.
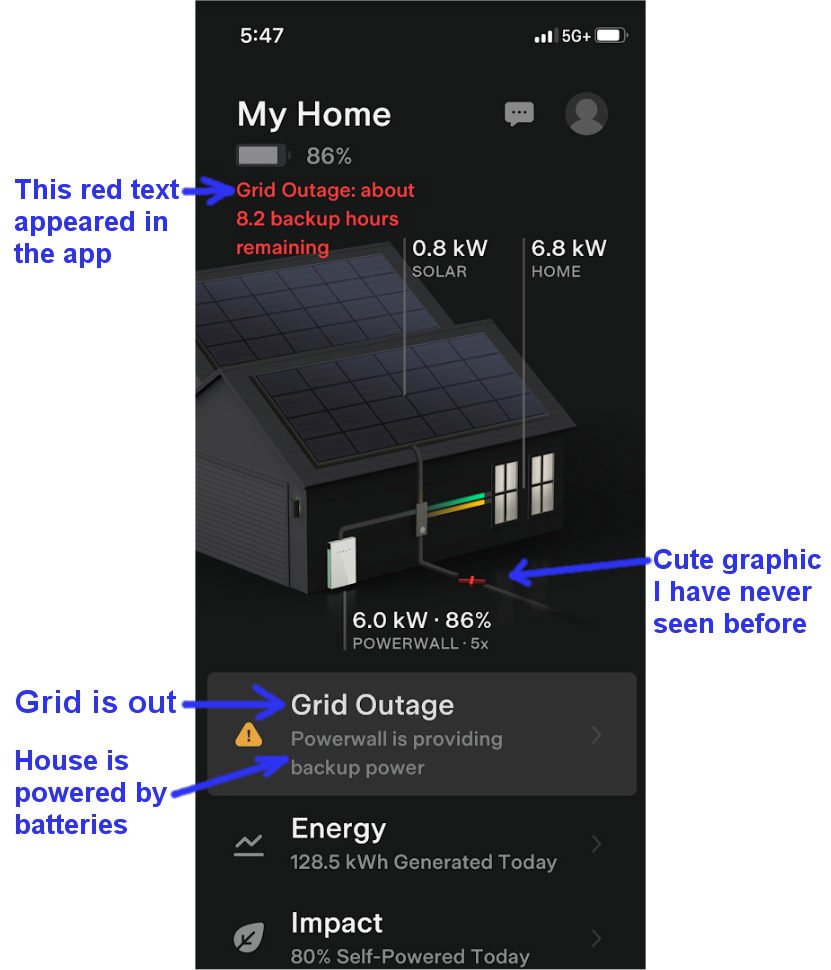
Update 8/27/2023 - at 5:47pm this day the first power outage occurred since turning on my Powerwall batteries and solar panel install. The Tesla app alerted me this occurred, and displayed the screen below (my annotations in blue):
That's it! That's all the pictures and movies. All done!
![]()